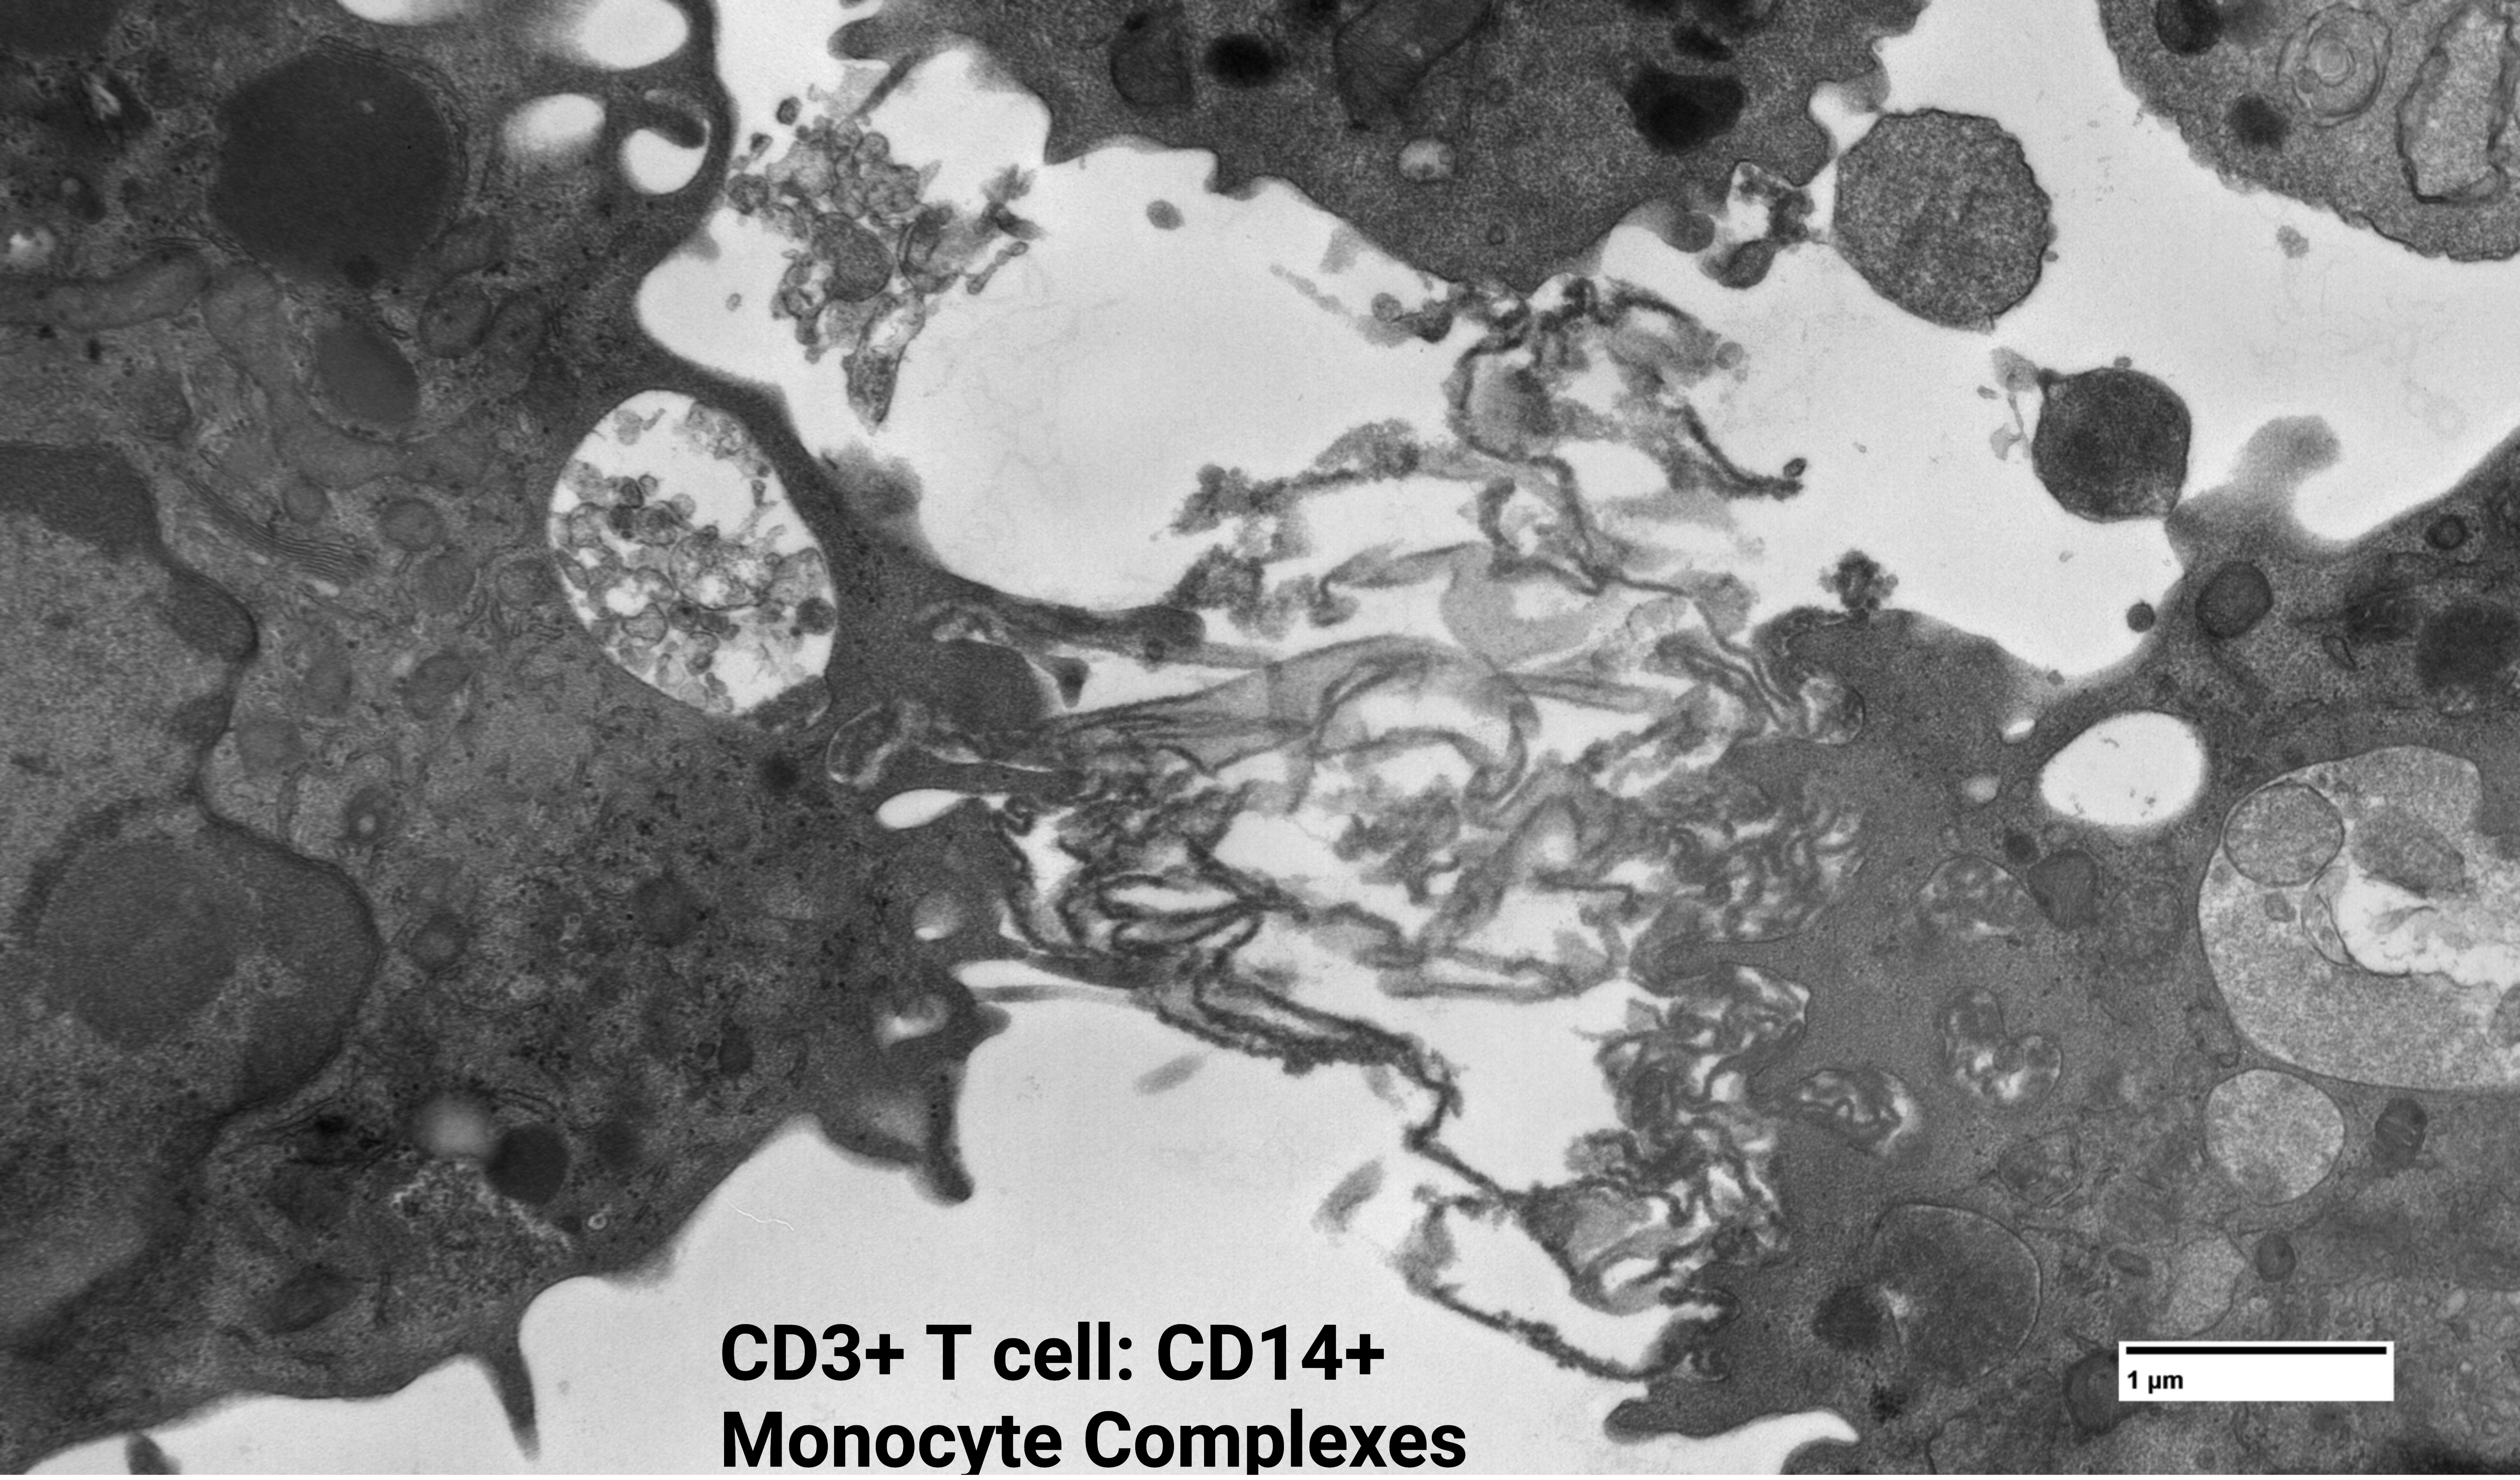
Transmission Electron Microscopy of Human T Cells
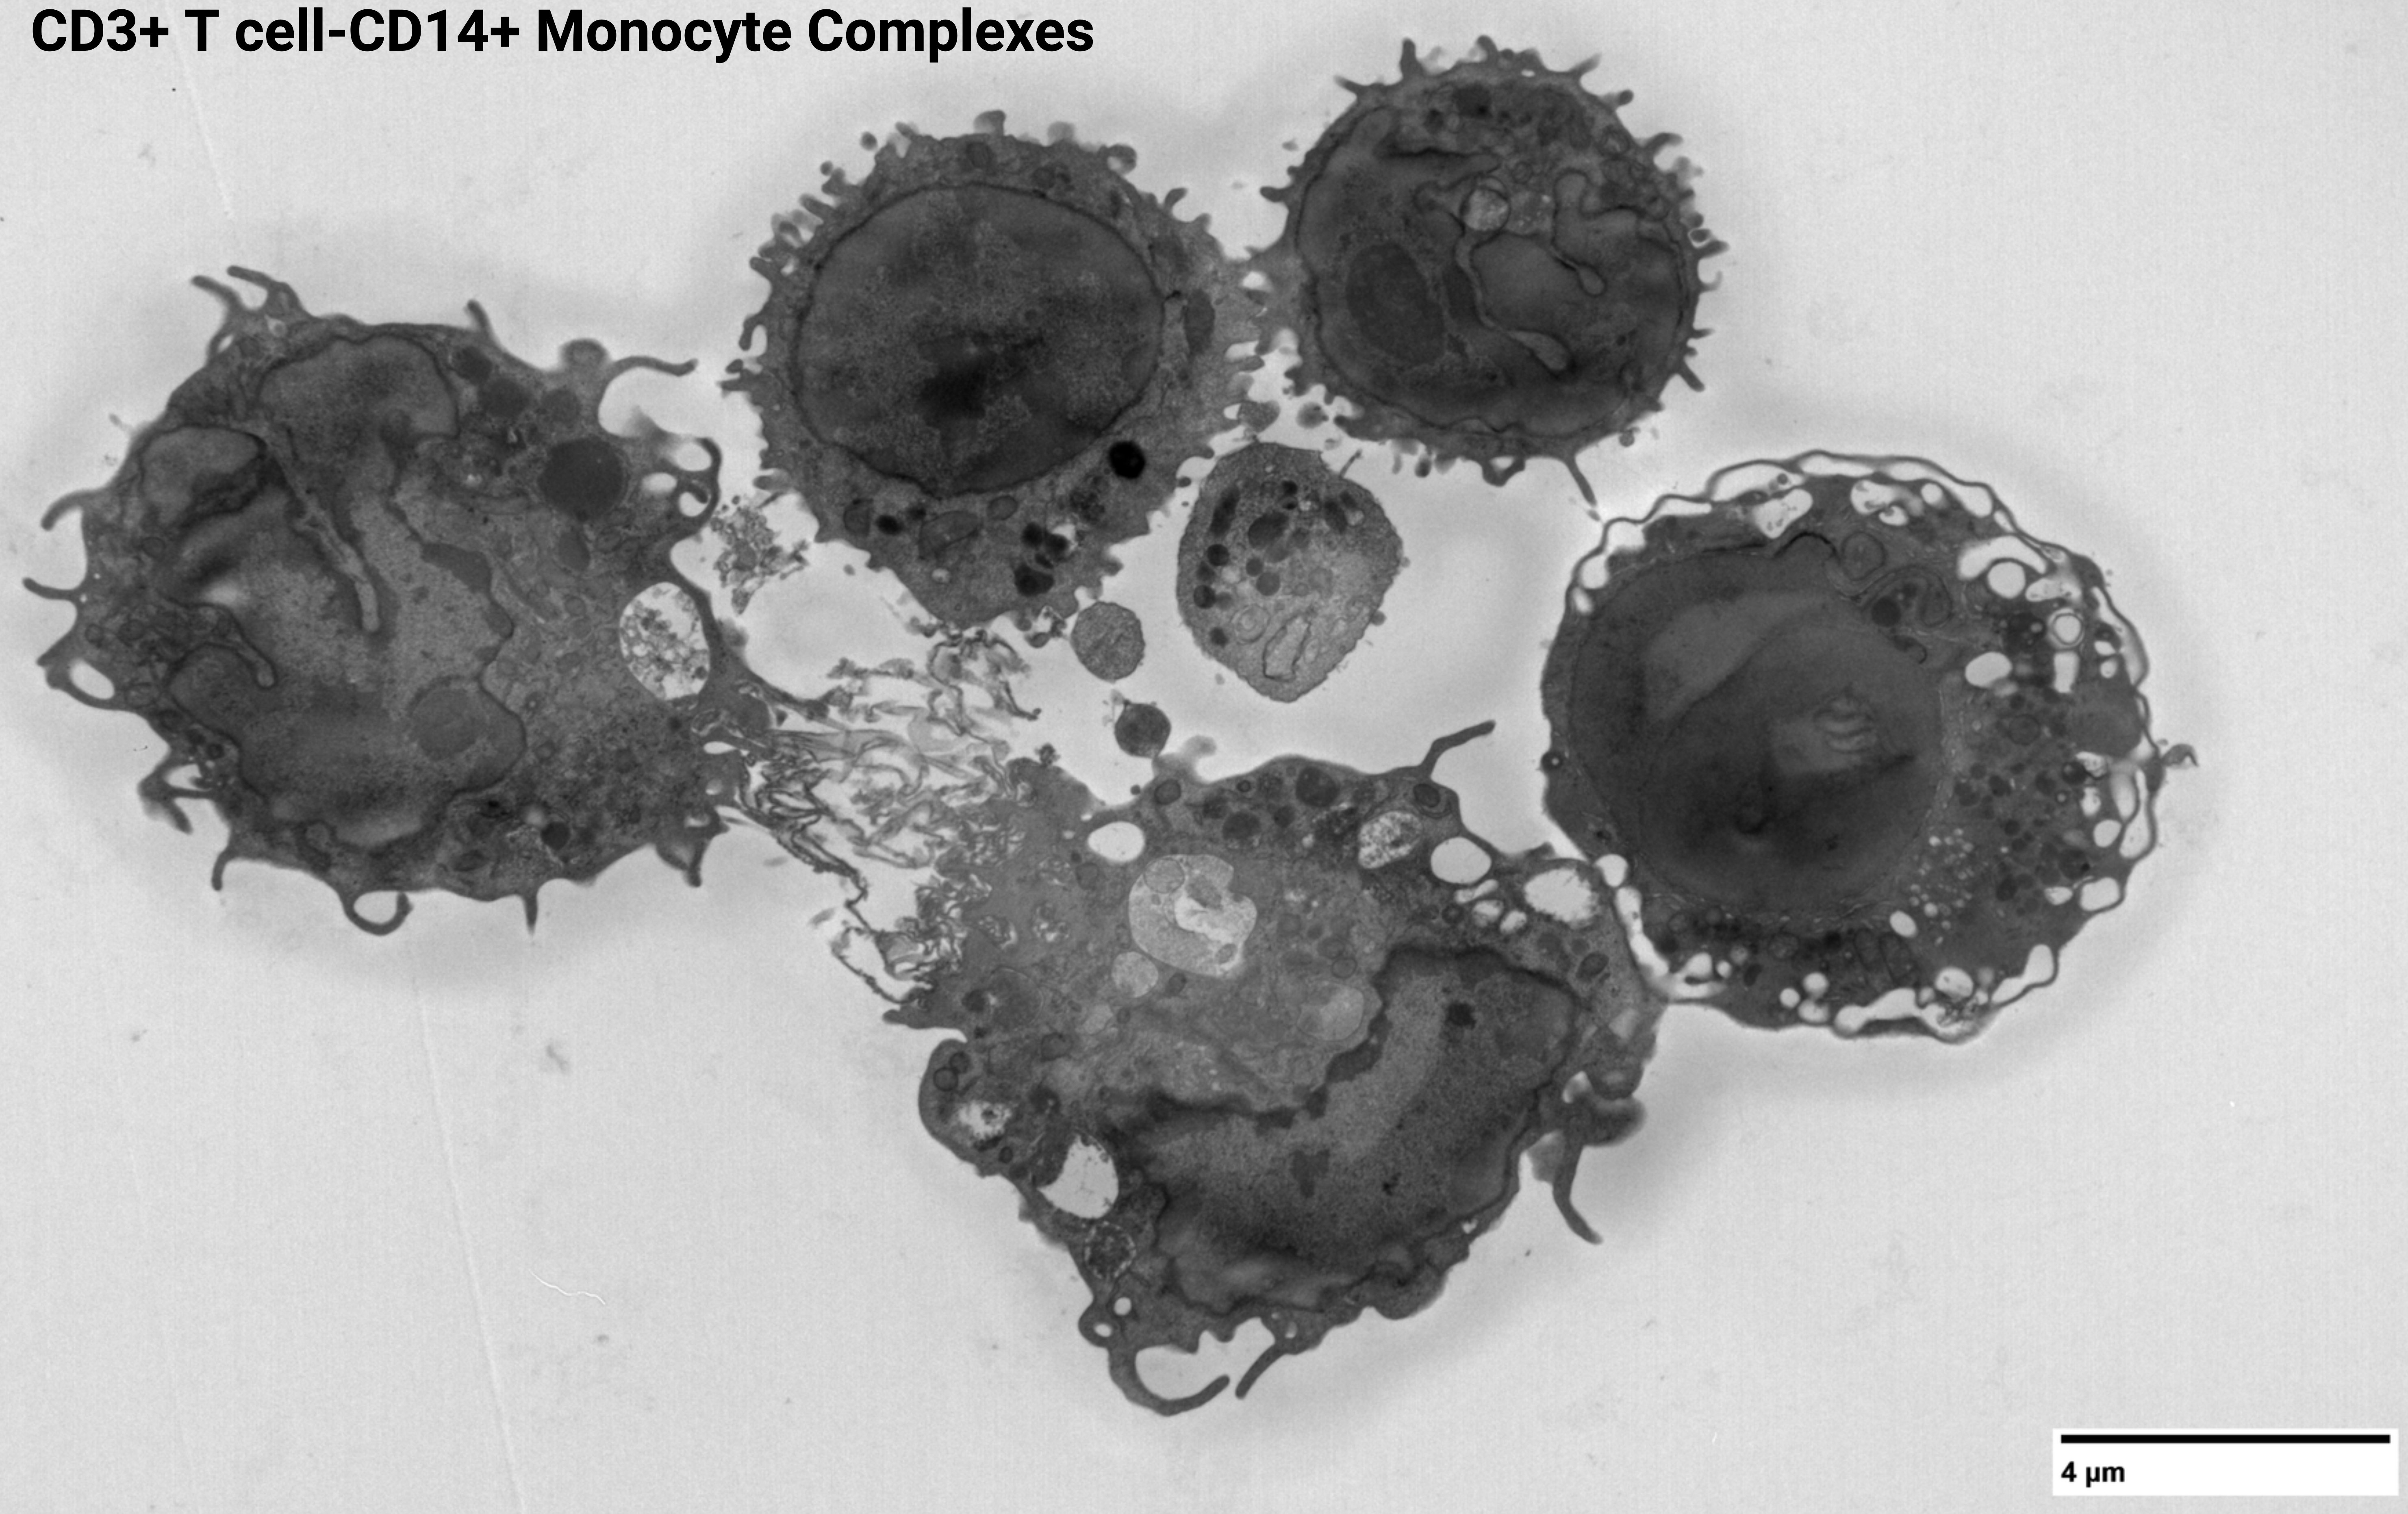
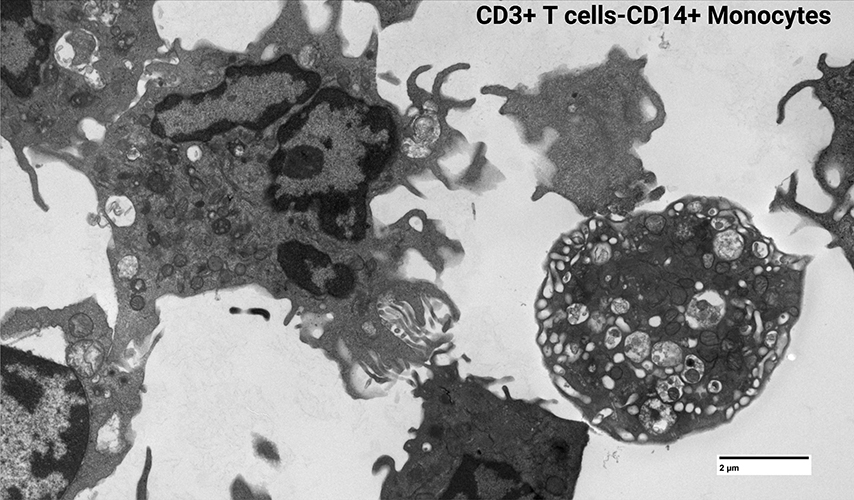
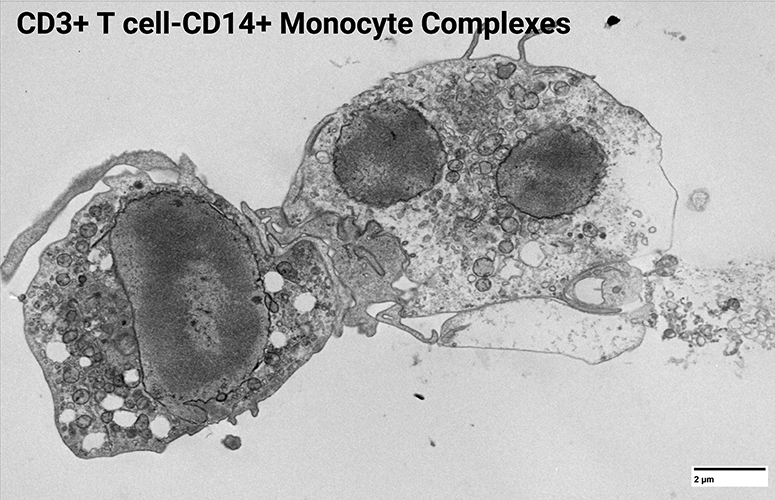
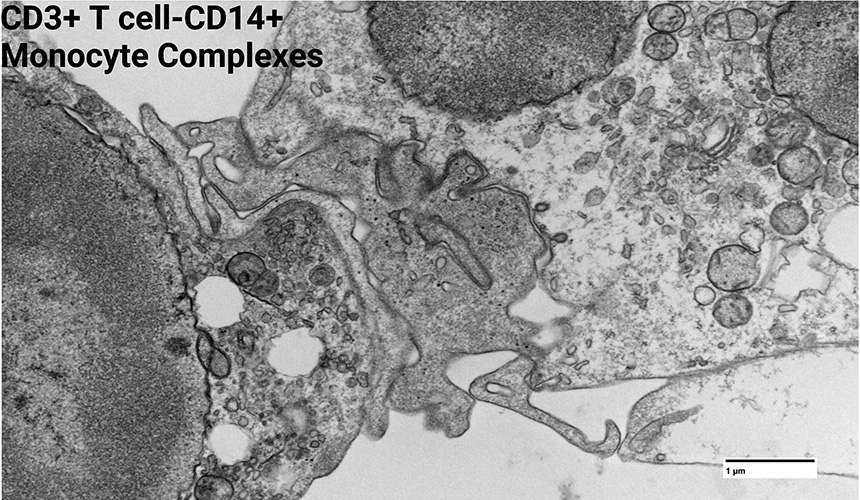
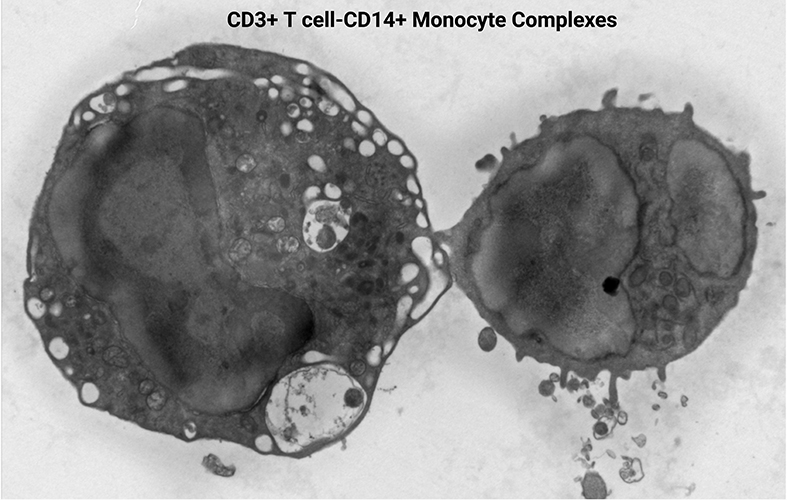
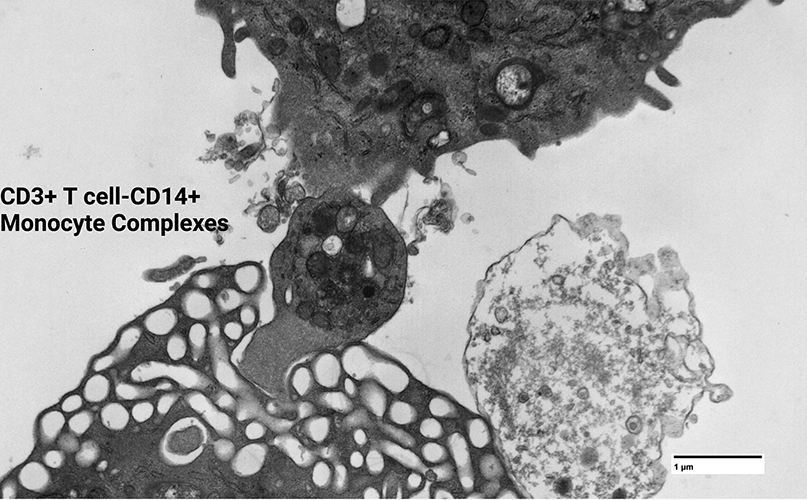
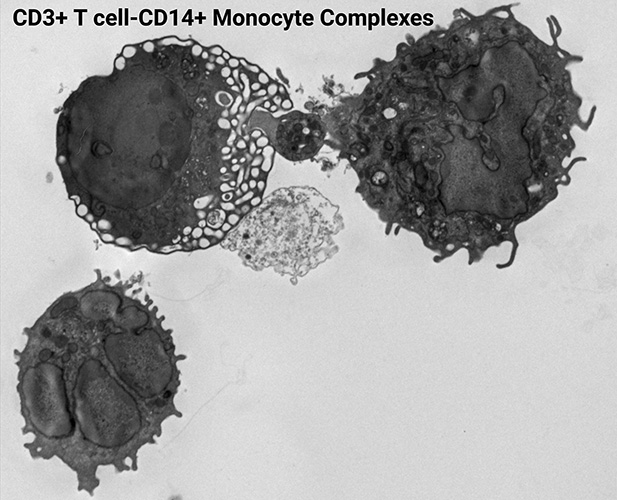
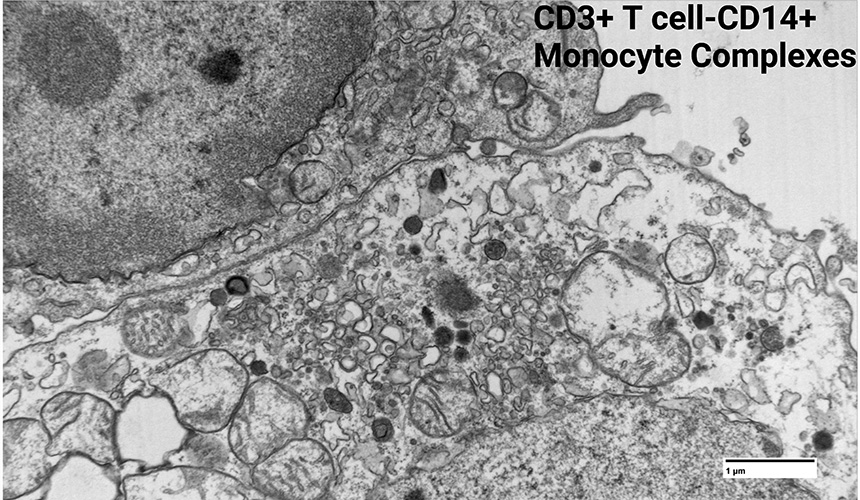
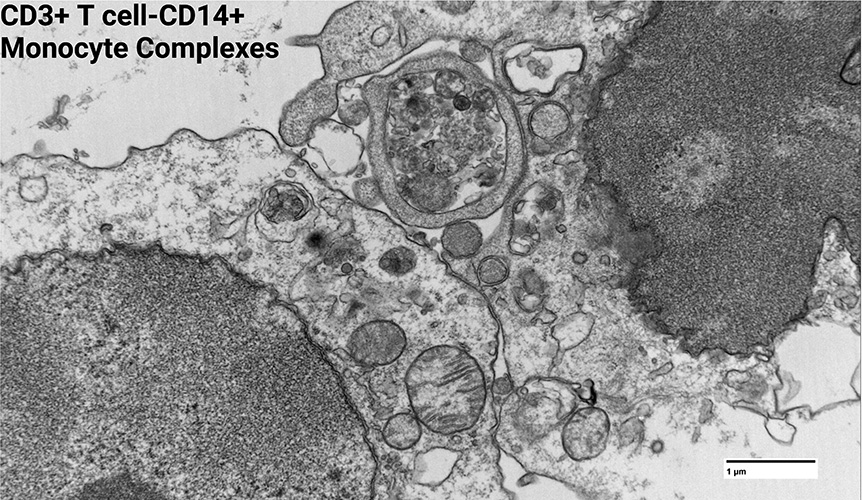
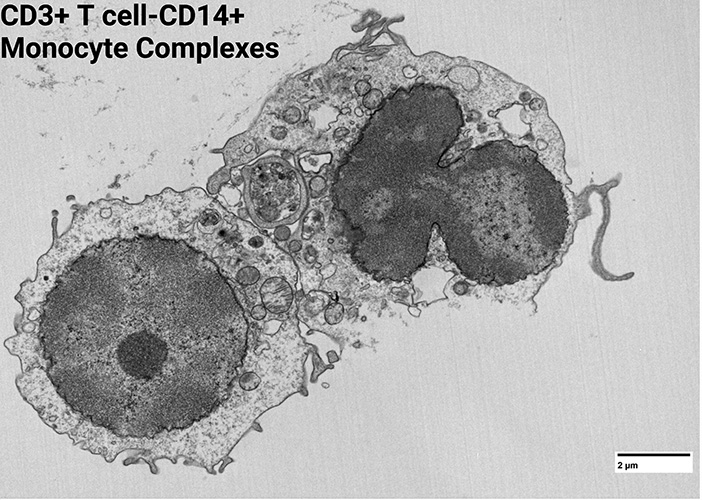
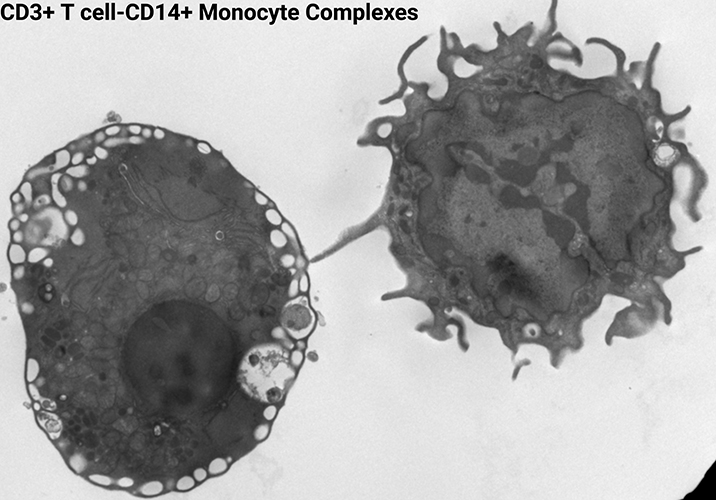
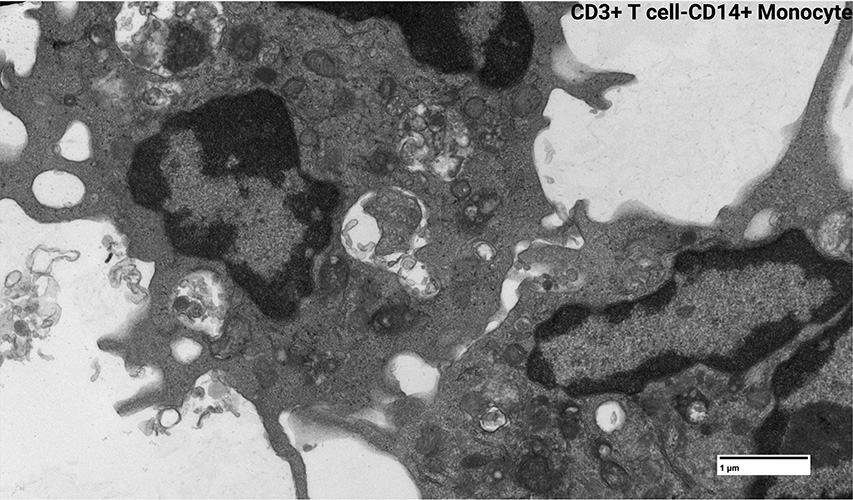
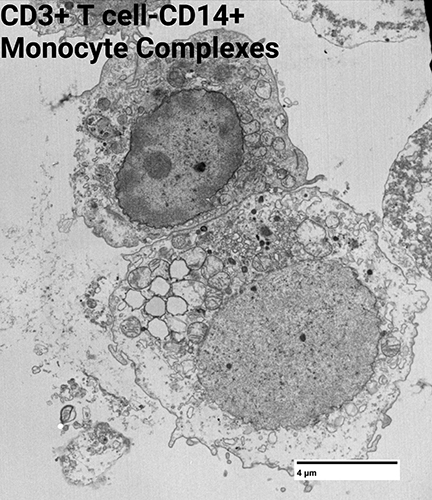
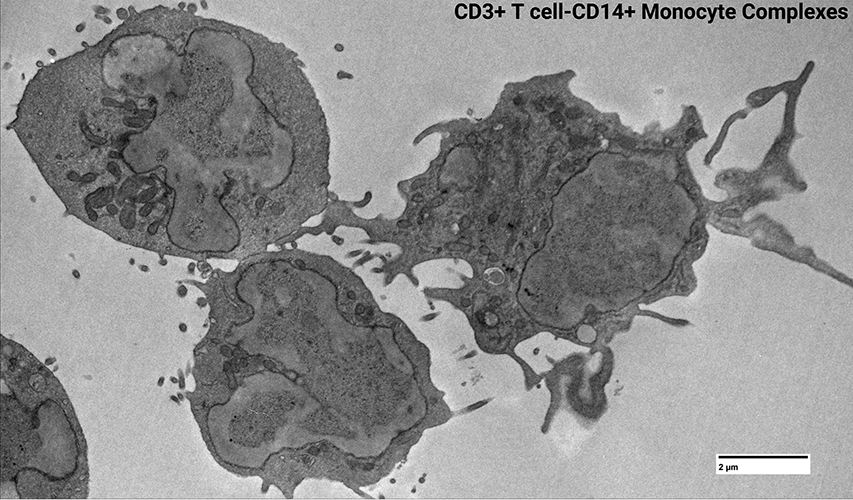
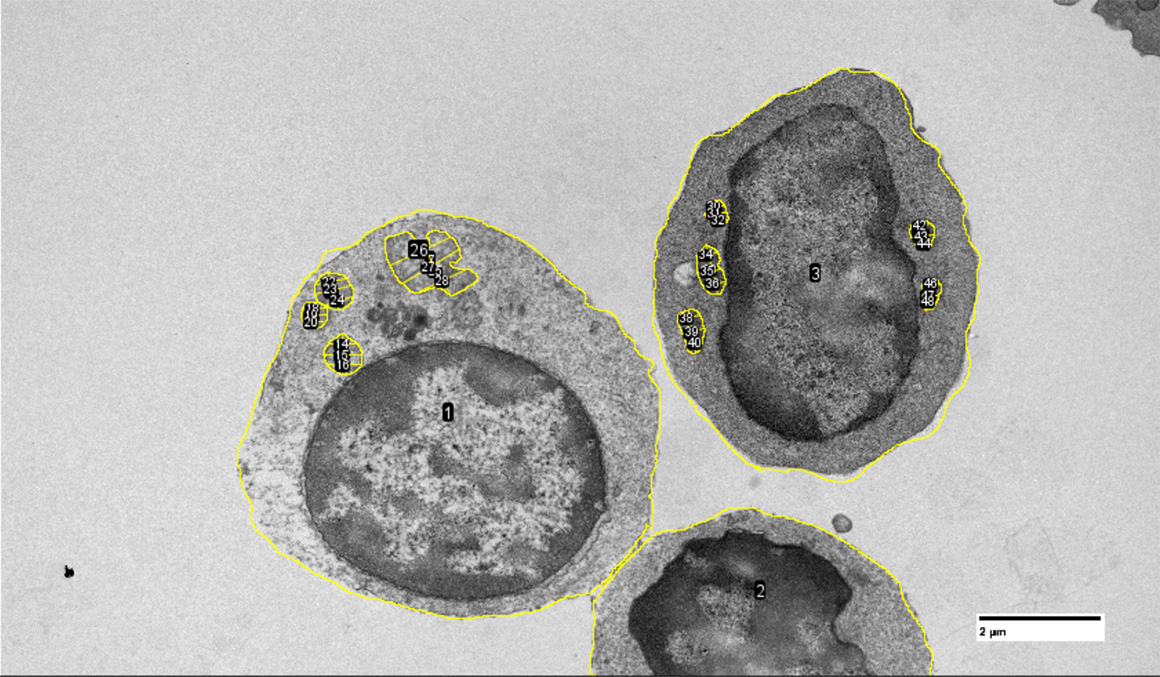
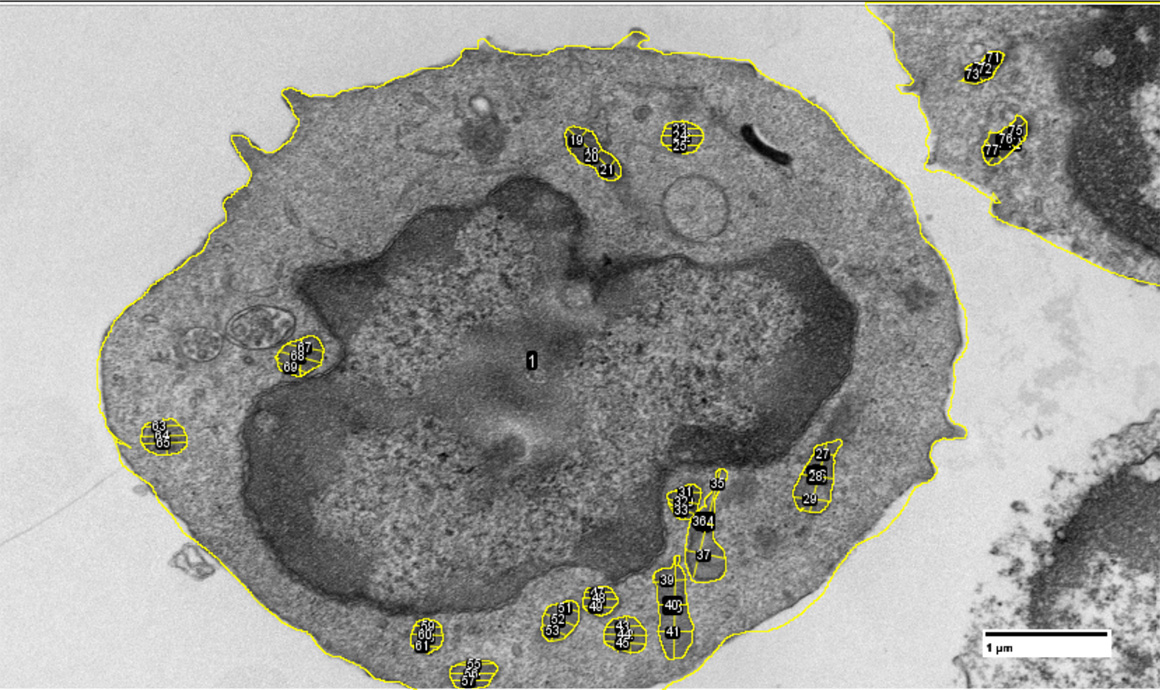
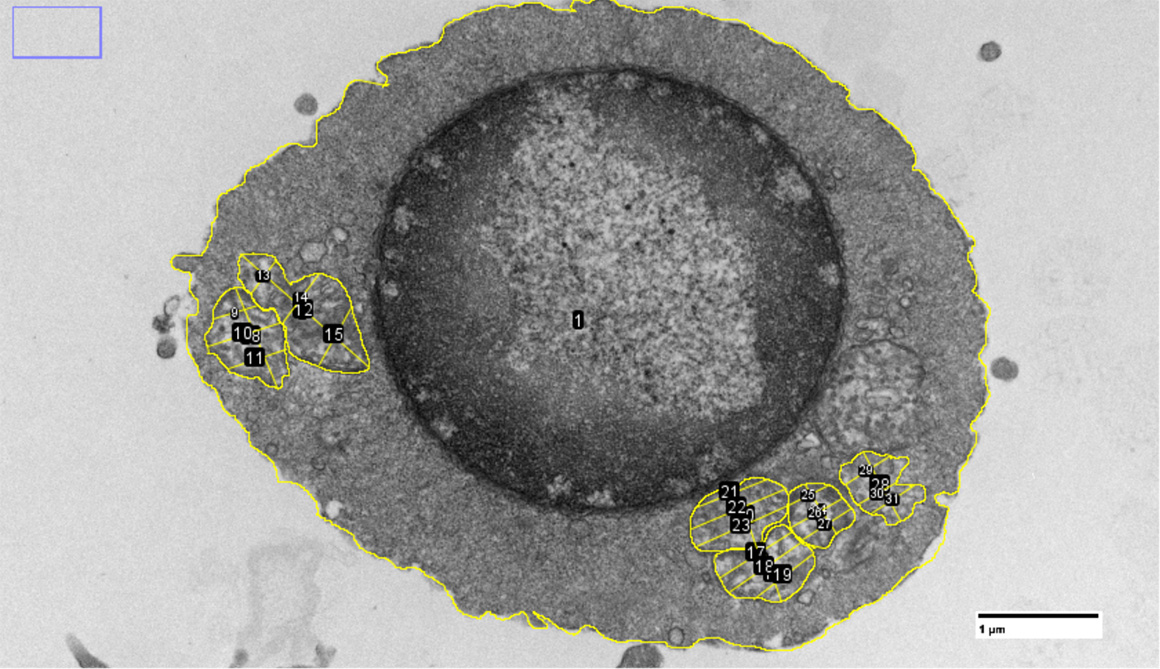
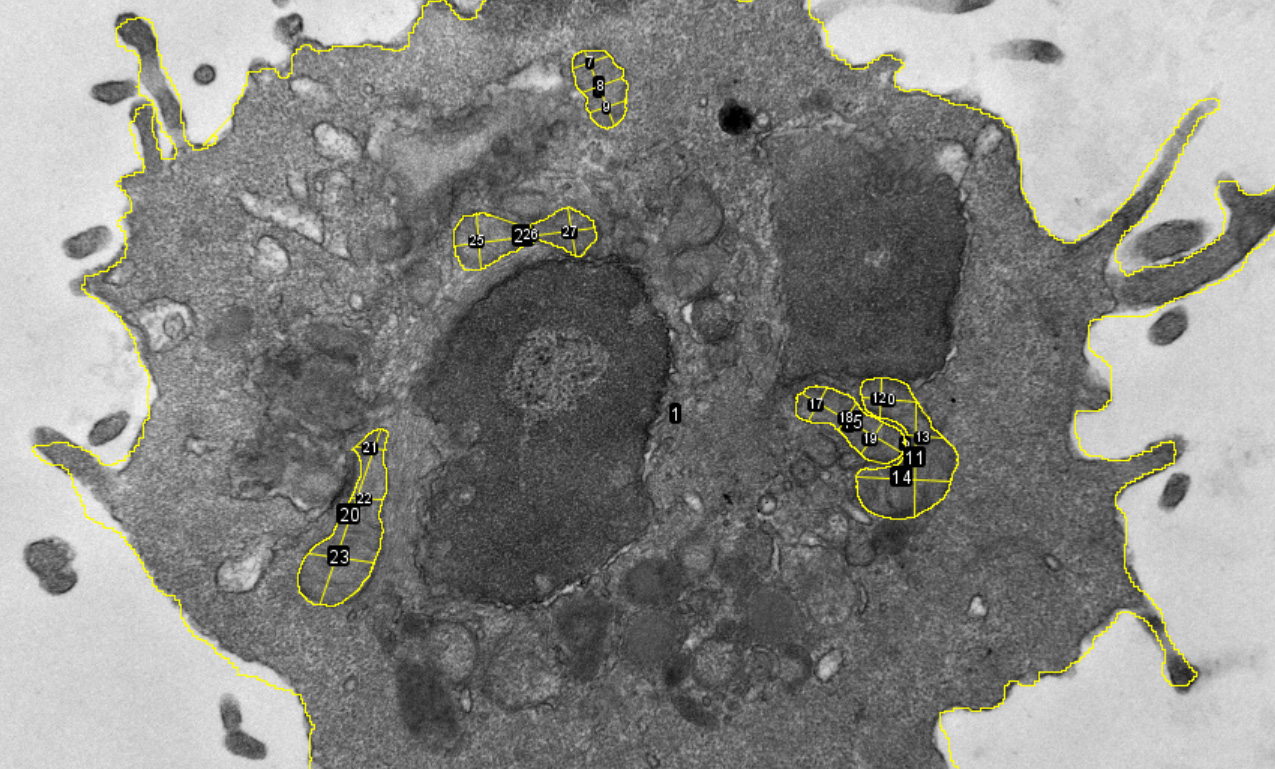
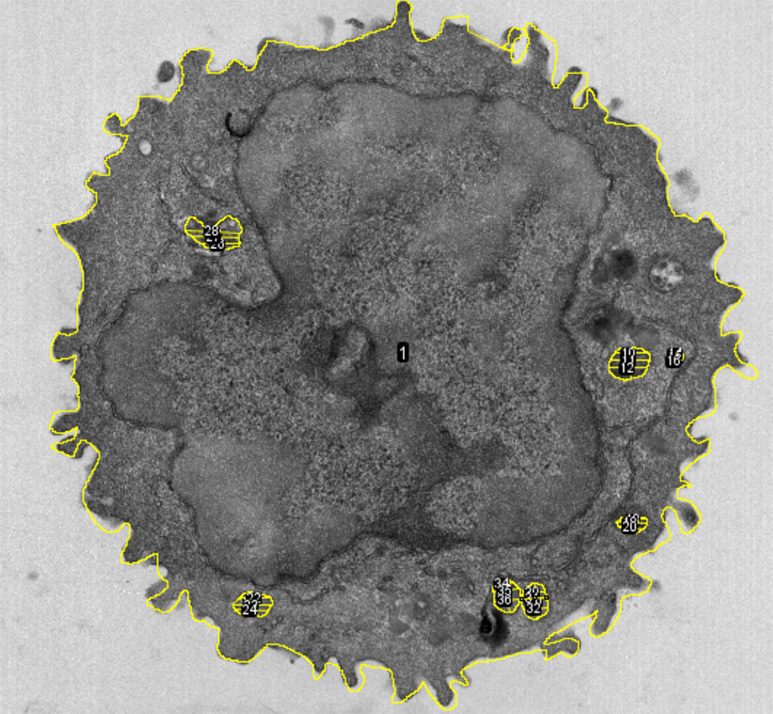
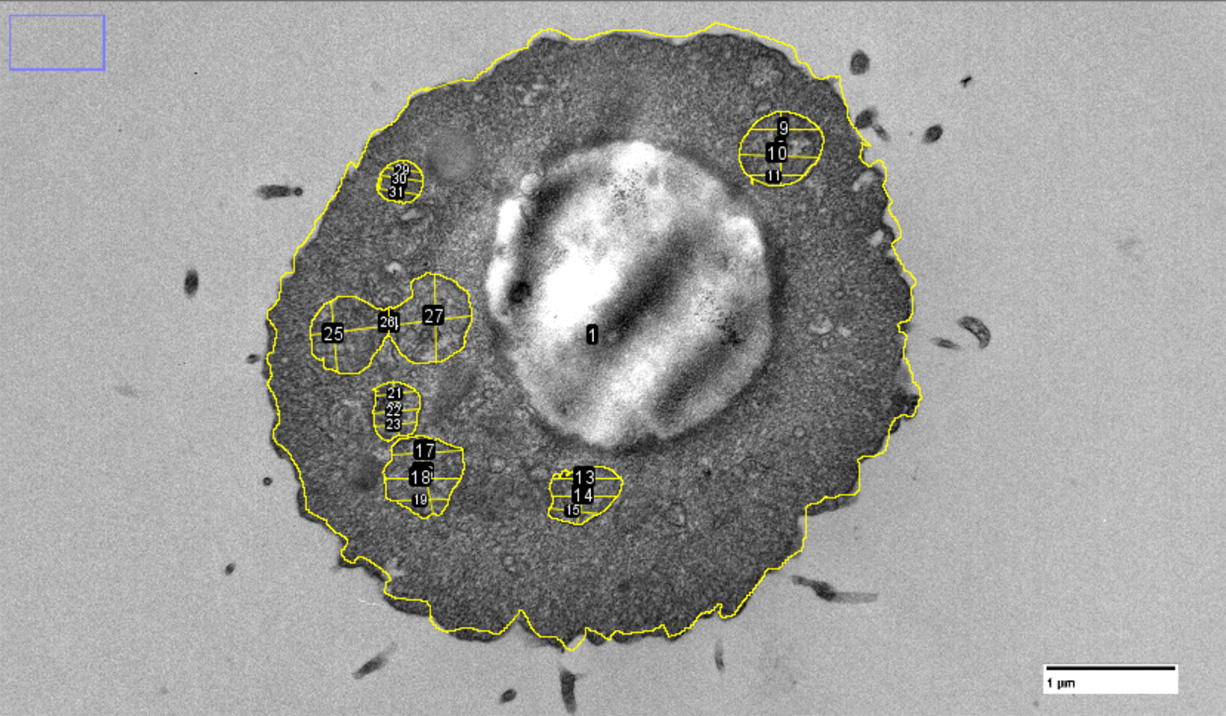
Transmission Electron Microscopy of T Cell–Monocyte Complexes. These high-resolution transmission electron microscopy (TEM) images depict CD3⁺ T cell–CD14⁺ monocyte complexes sorted from human peripheral blood mononuclear cells (PBMCs). These tightly bound immune cell pairs represent stable, physiologically relevant interactions observed in inflammatory and infectious conditions. Using flow cytometry, complexes were isolated based on their dual surface marker expression and intact cell-cell interface.
TEM imaging reveals ultrastructural details of the interacting membranes and cytoplasmic content, allowing for close examination of cellular morphology, membrane junctions, and potential vesicular exchange. These images provide visual evidence of stable immune complexes that are now being analyzed for their transcriptional and functional signatures, including spatial transcriptomic profiling of downstream targets in complementary studies.
CGC Cell gallery
Understanding granular differences between CGC+ and non-CGC+ T cells. We sorted the CD4+ T cells and compared mitochondrial density and features. These studies are ongoing.
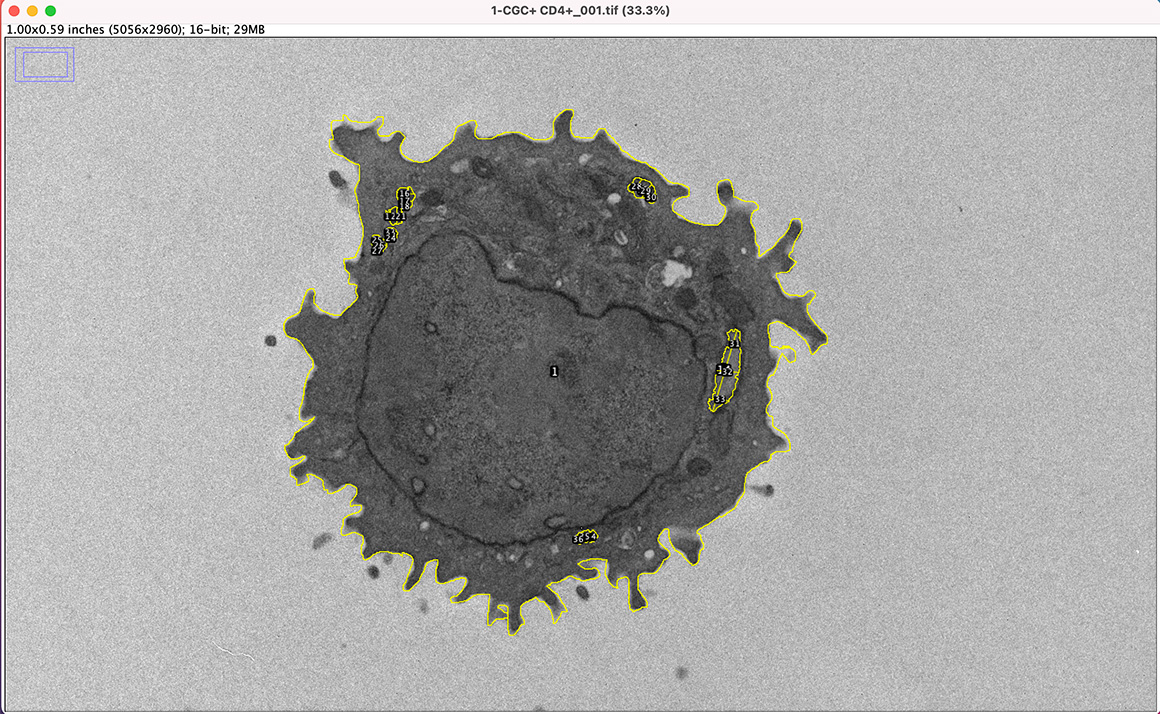
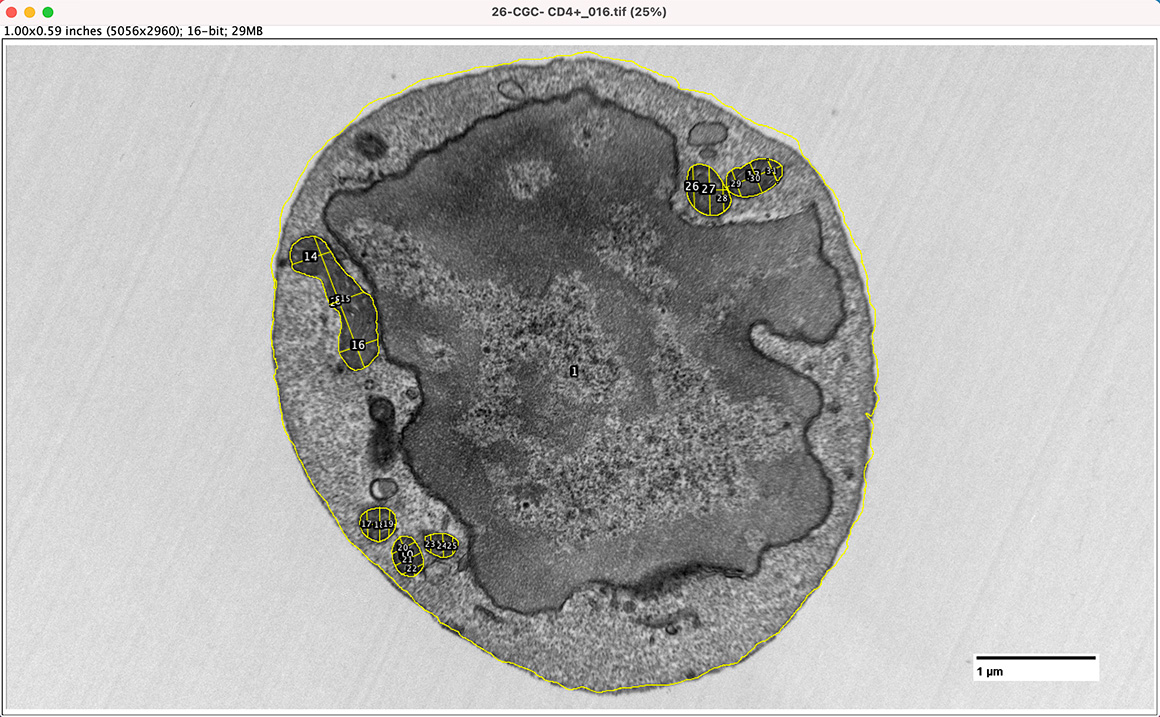
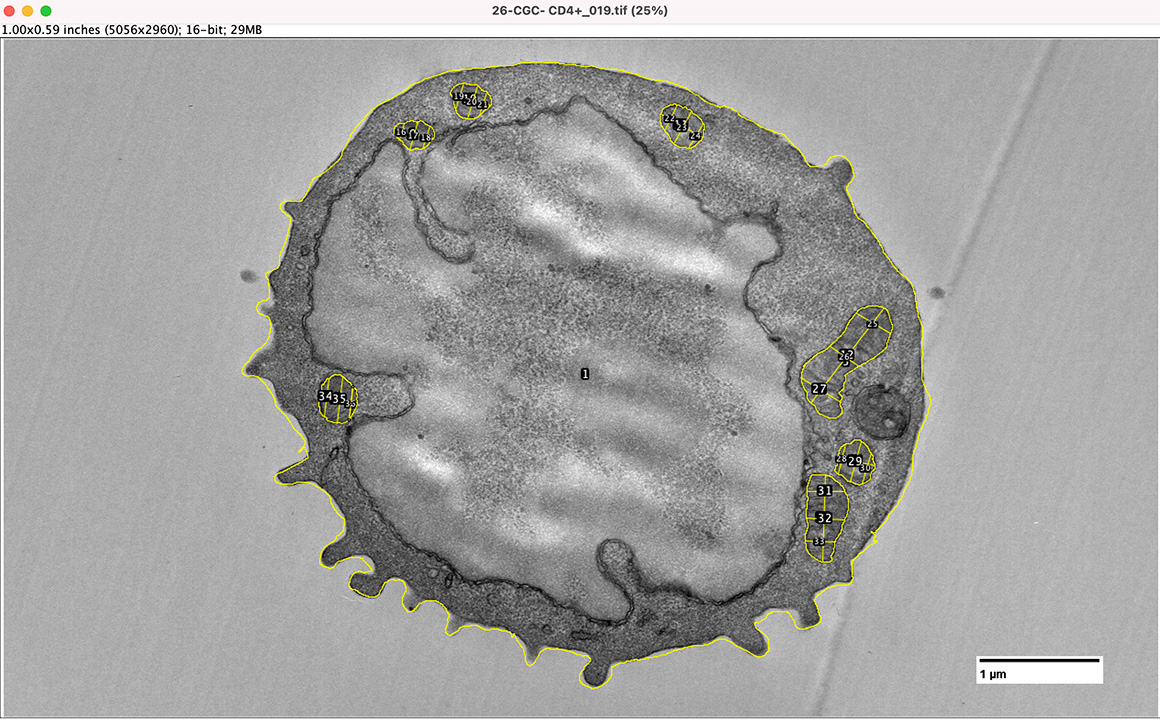
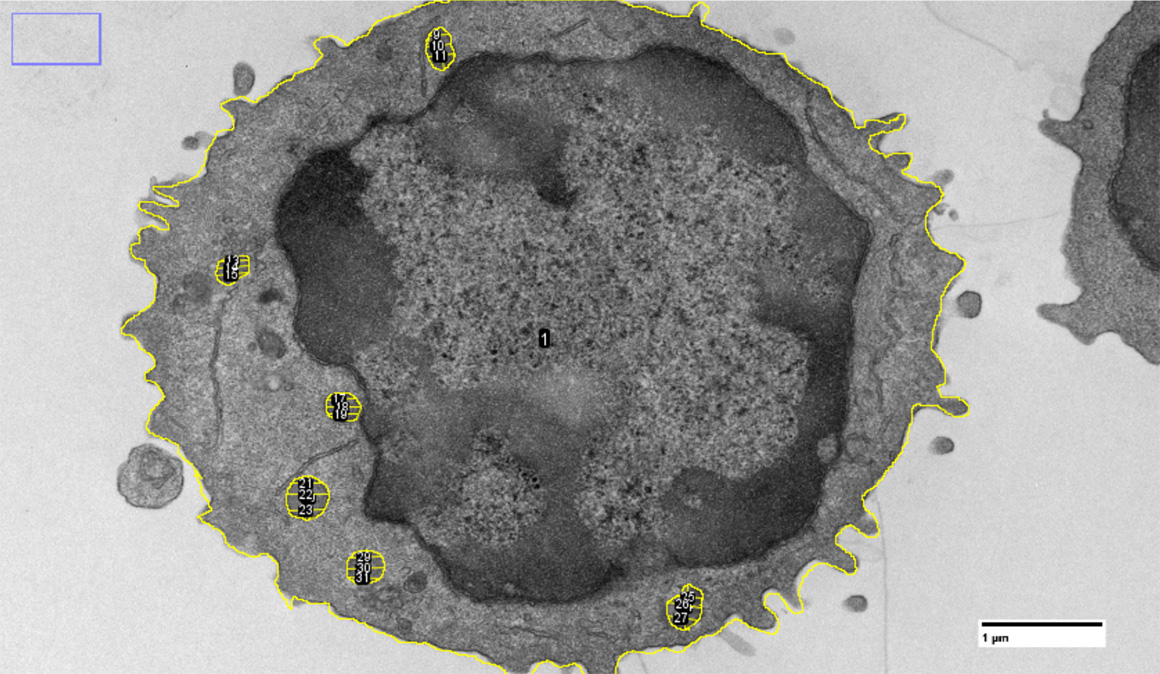
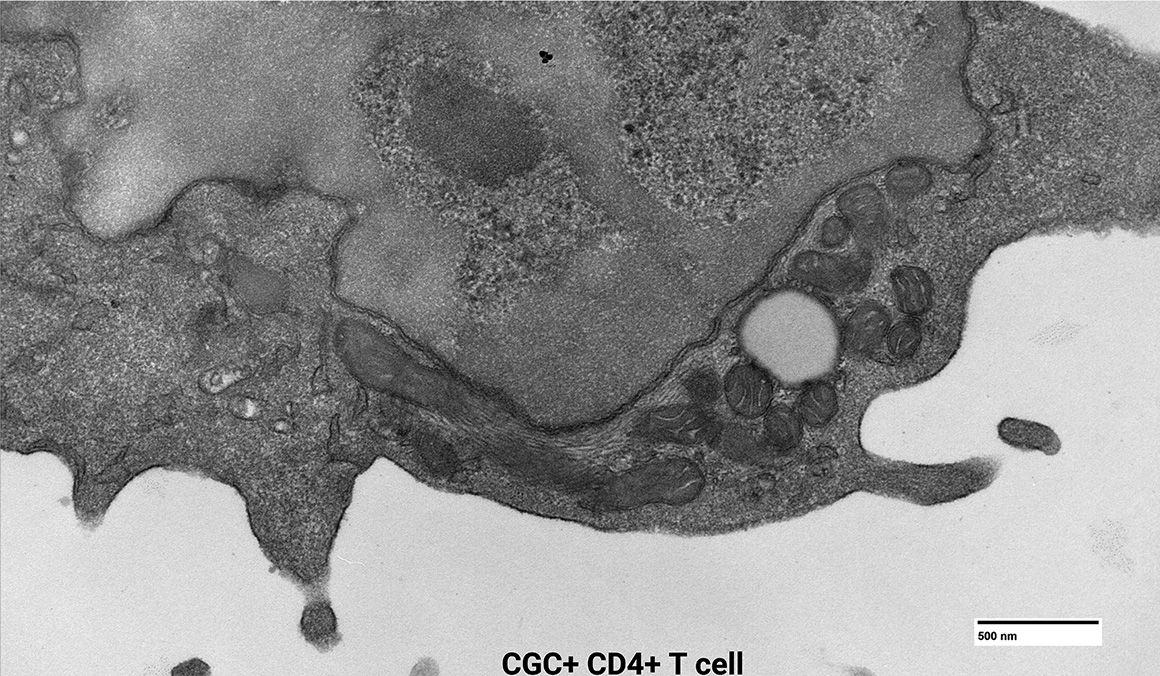
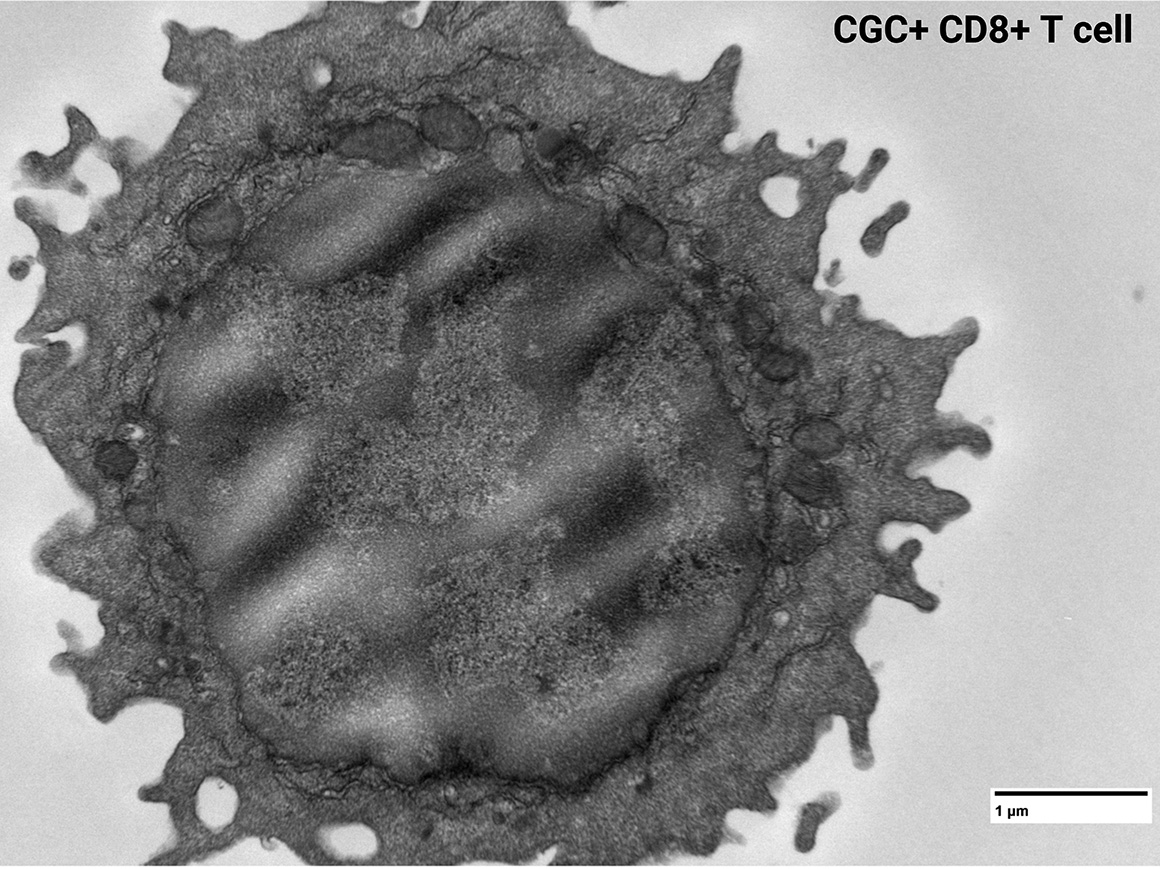
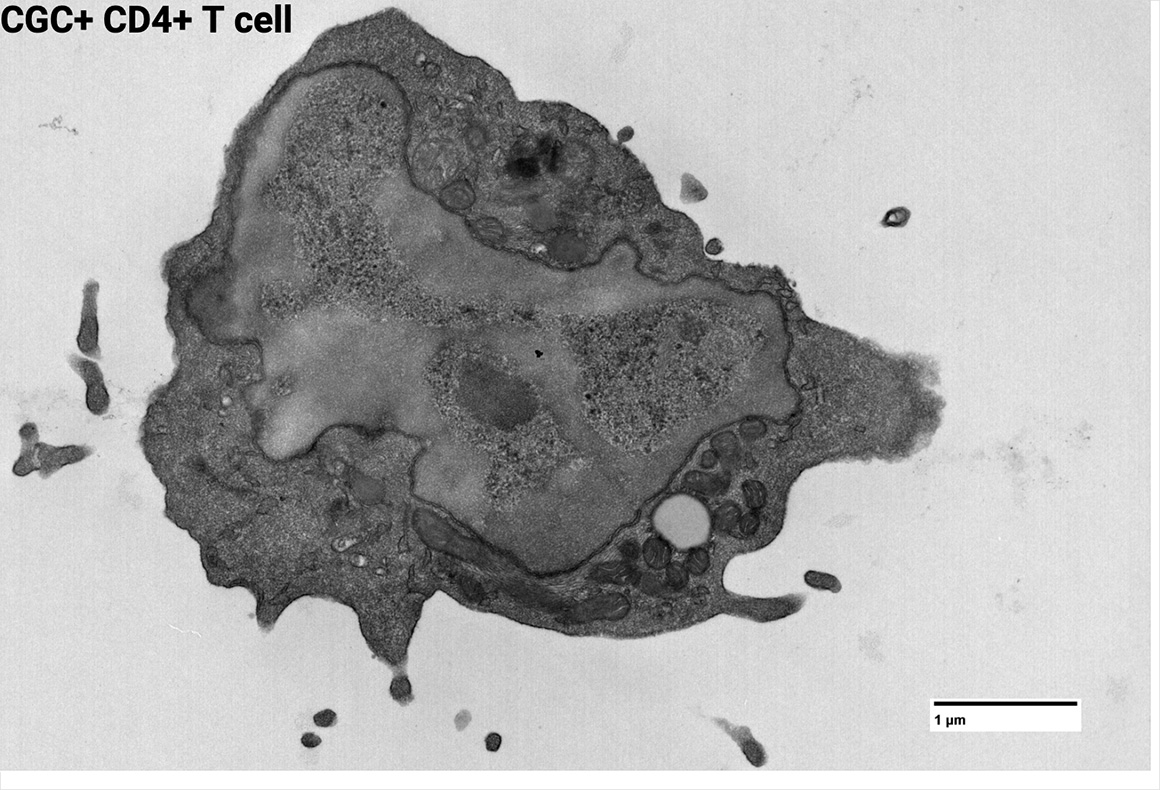
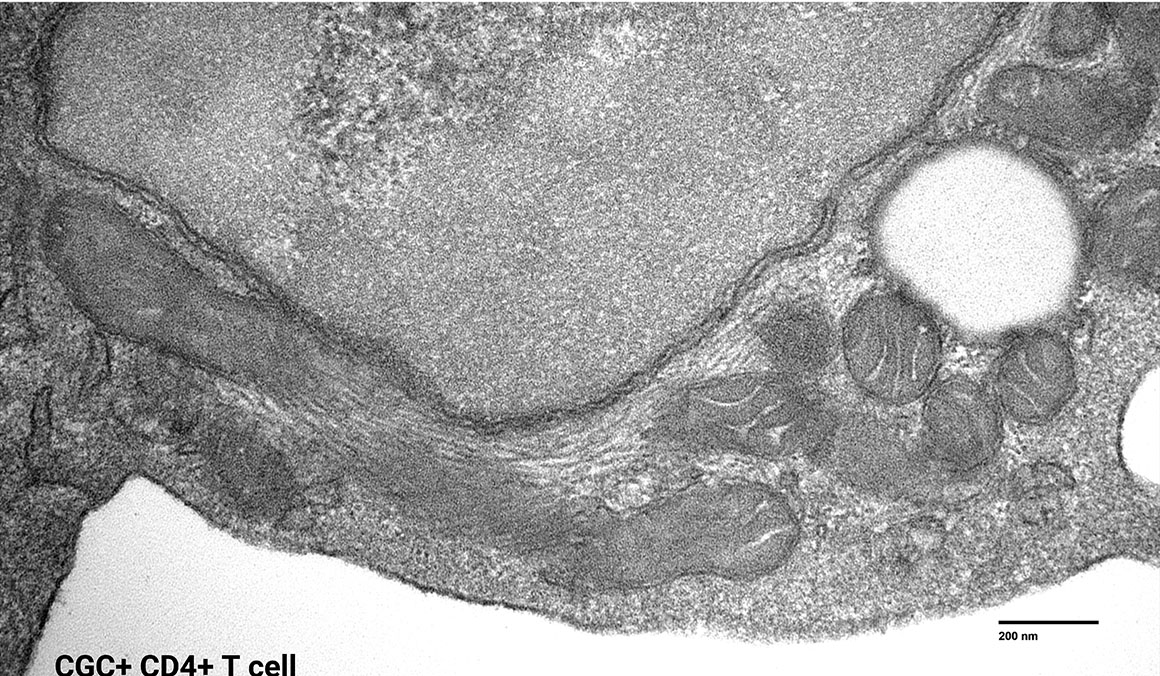
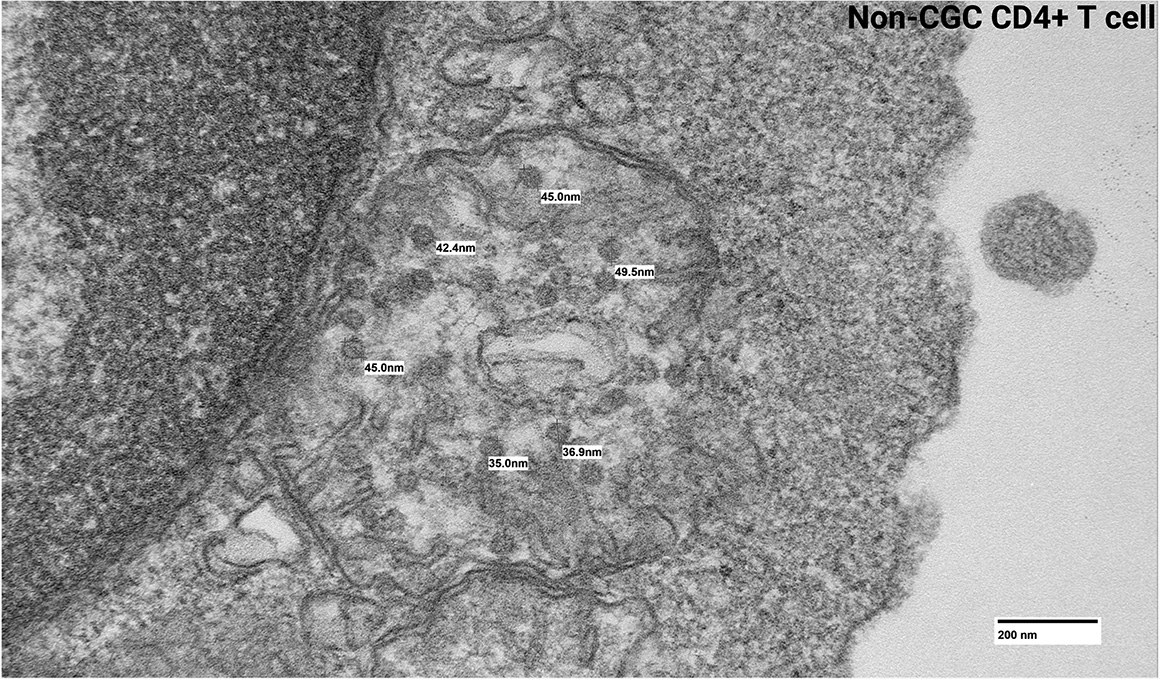
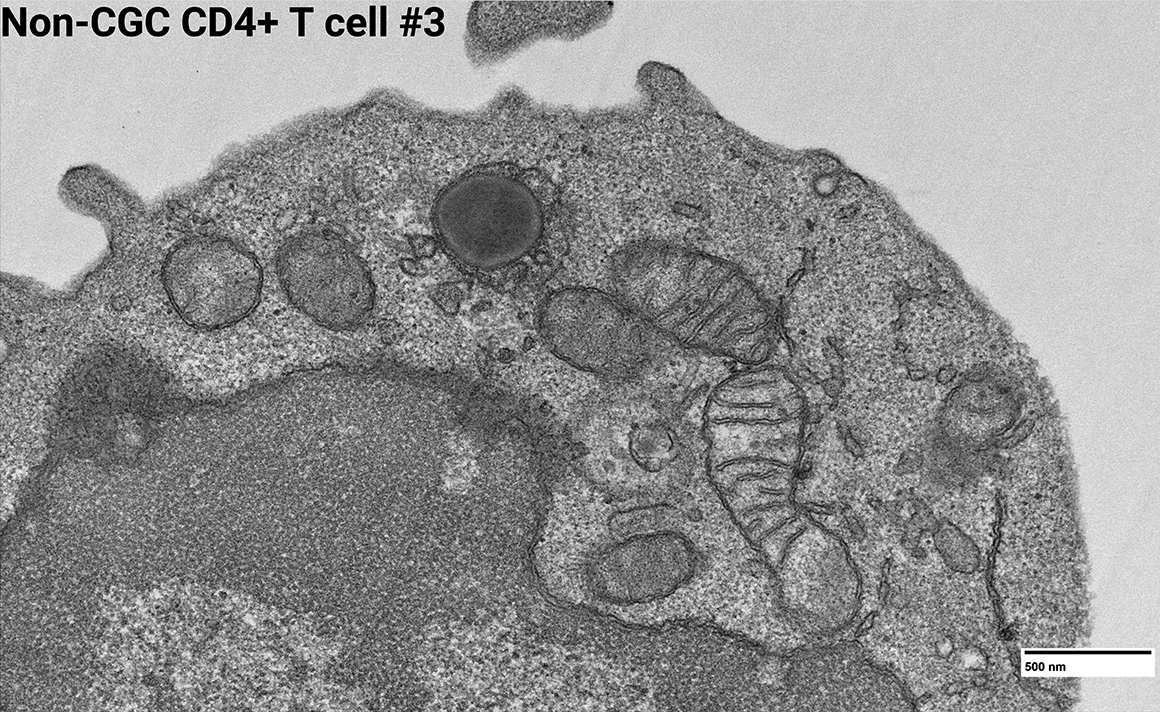
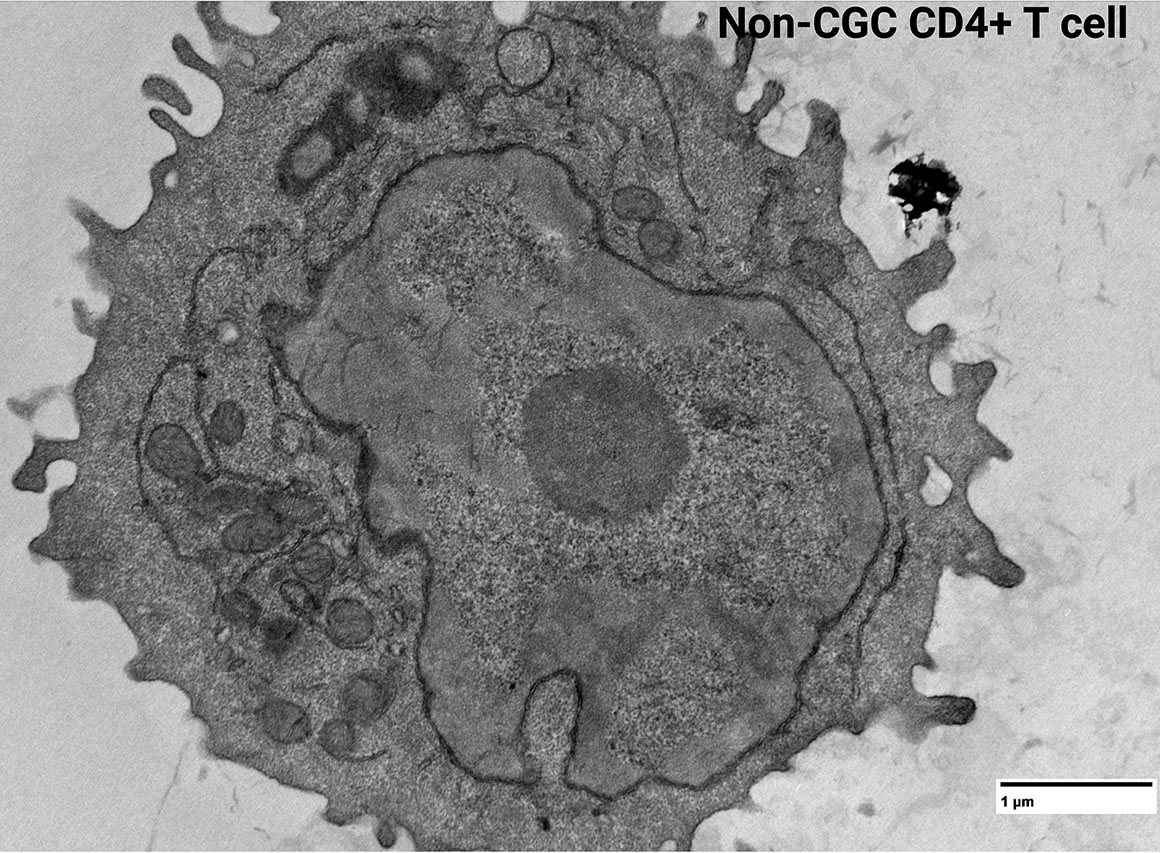
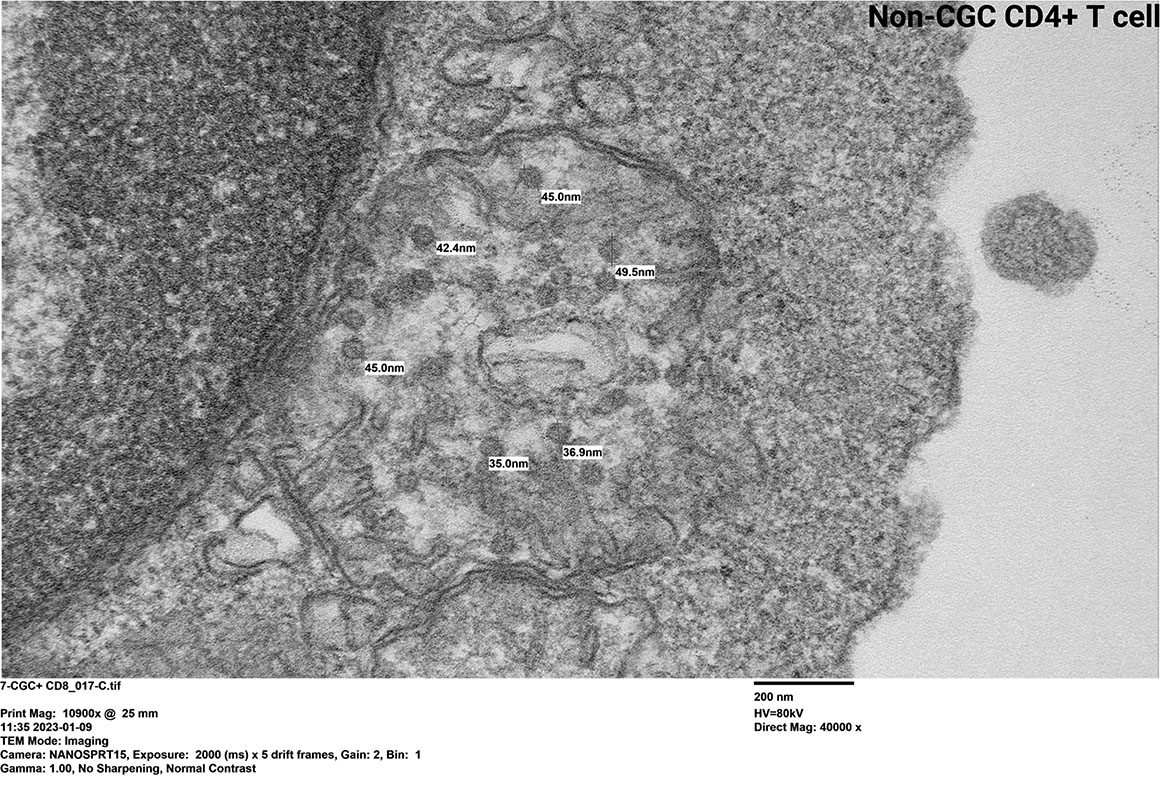
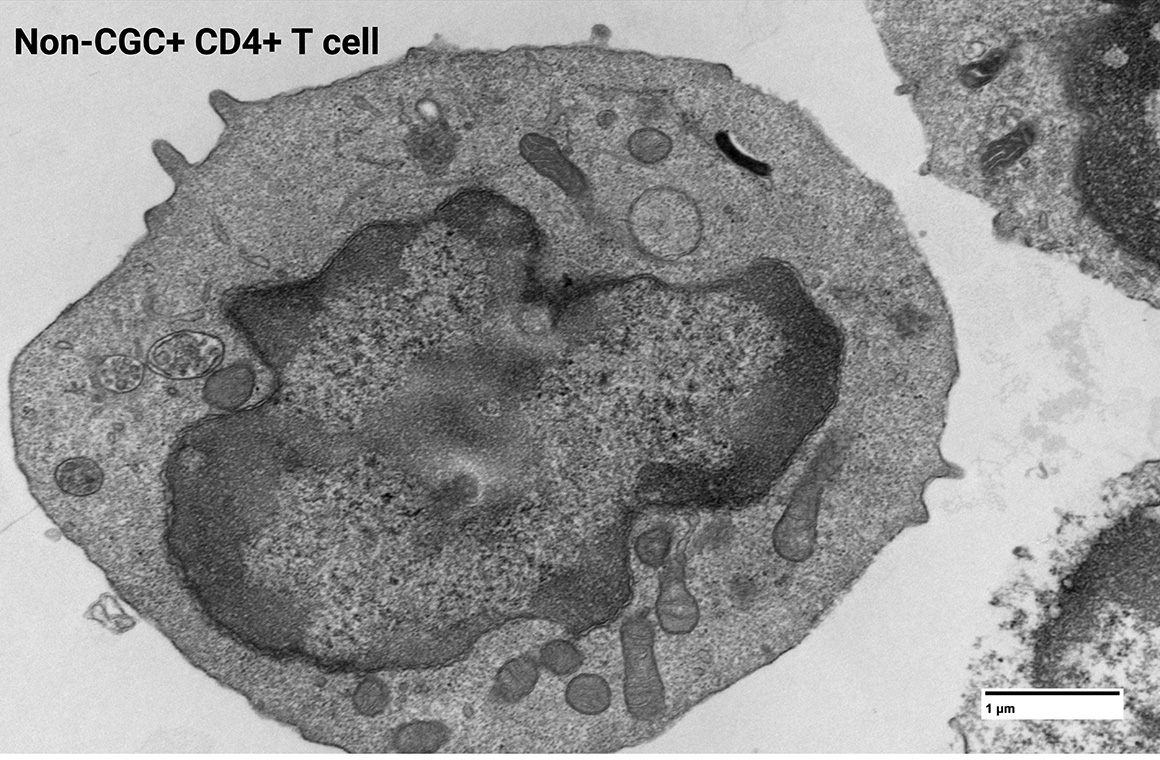
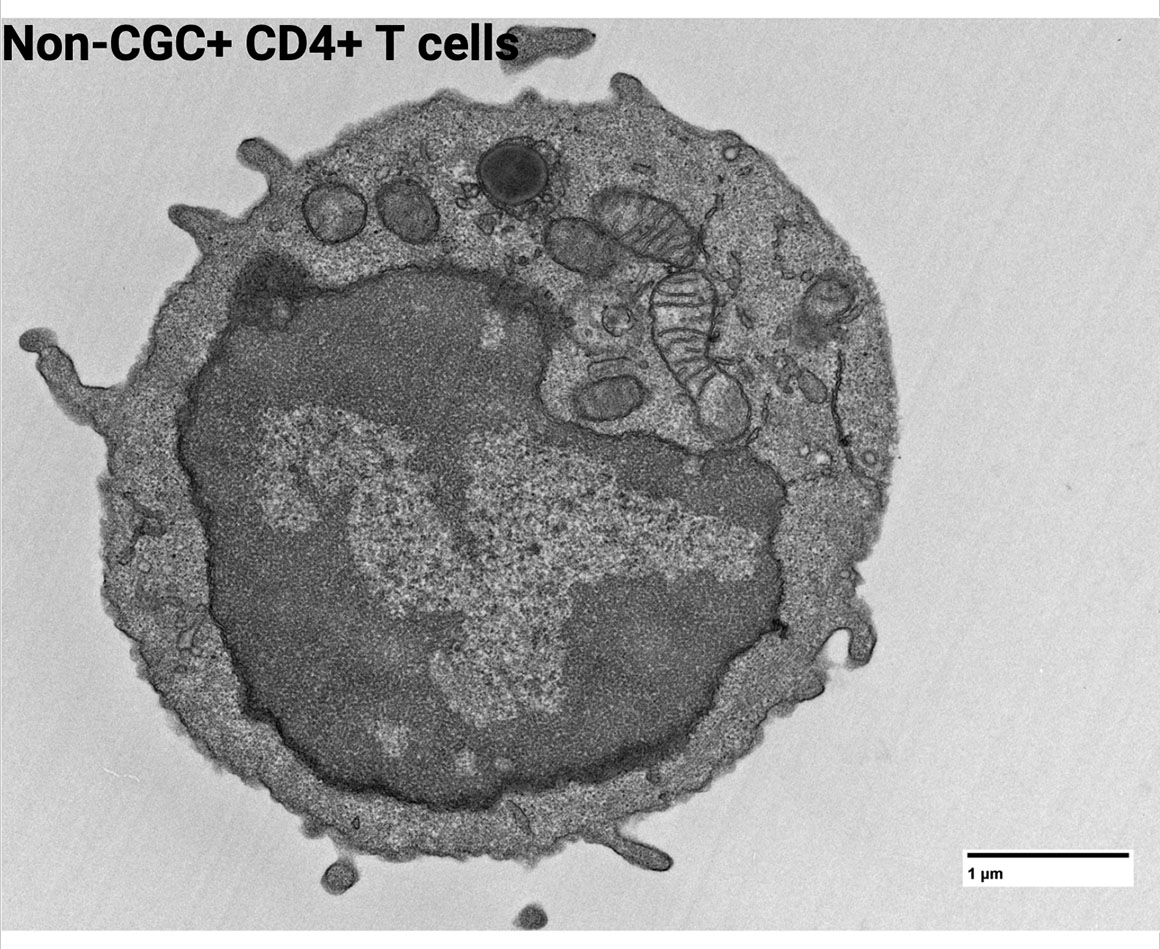
Electron micrographs of CD4⁺ T cells—left panel (CGC⁻) shows a solitary T cell with smooth contours and visible organelles; right panel (CGC⁺) shows an irregular membrane protrusion and altered morphology
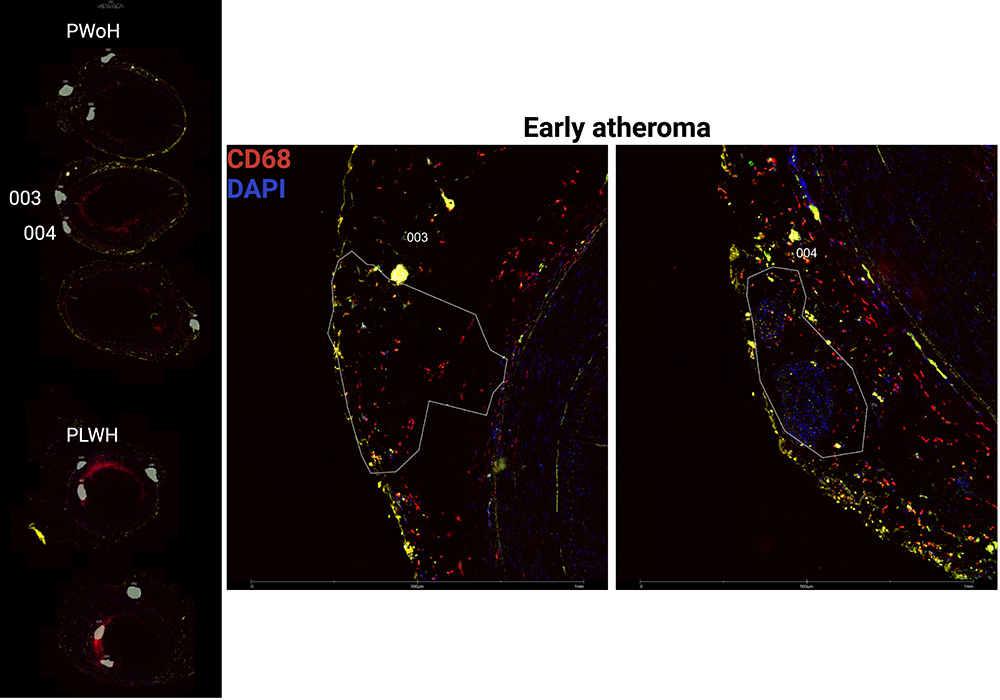
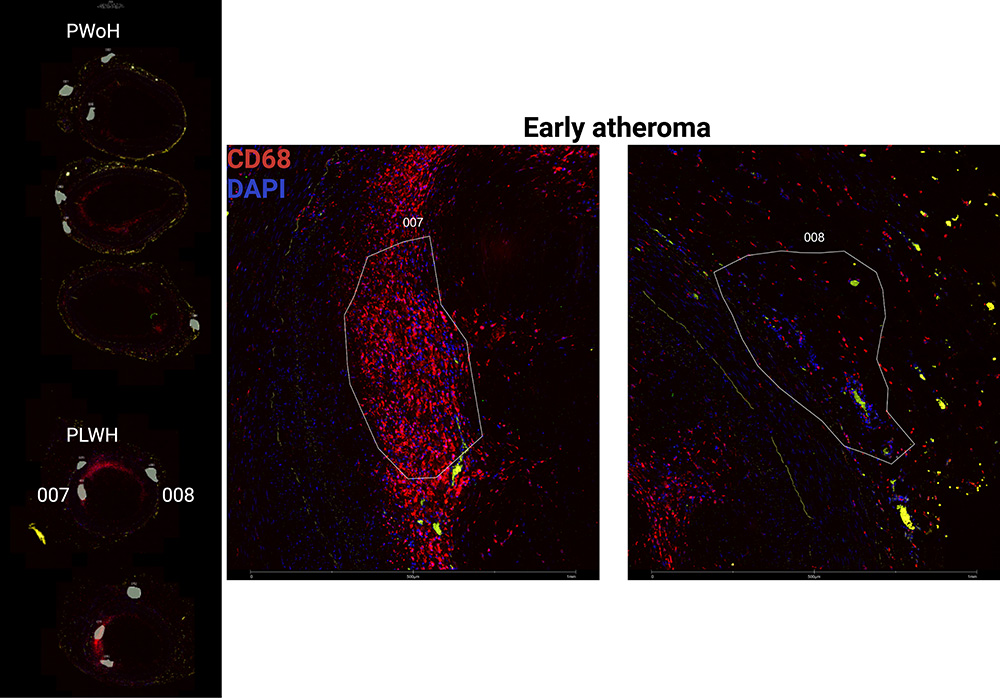
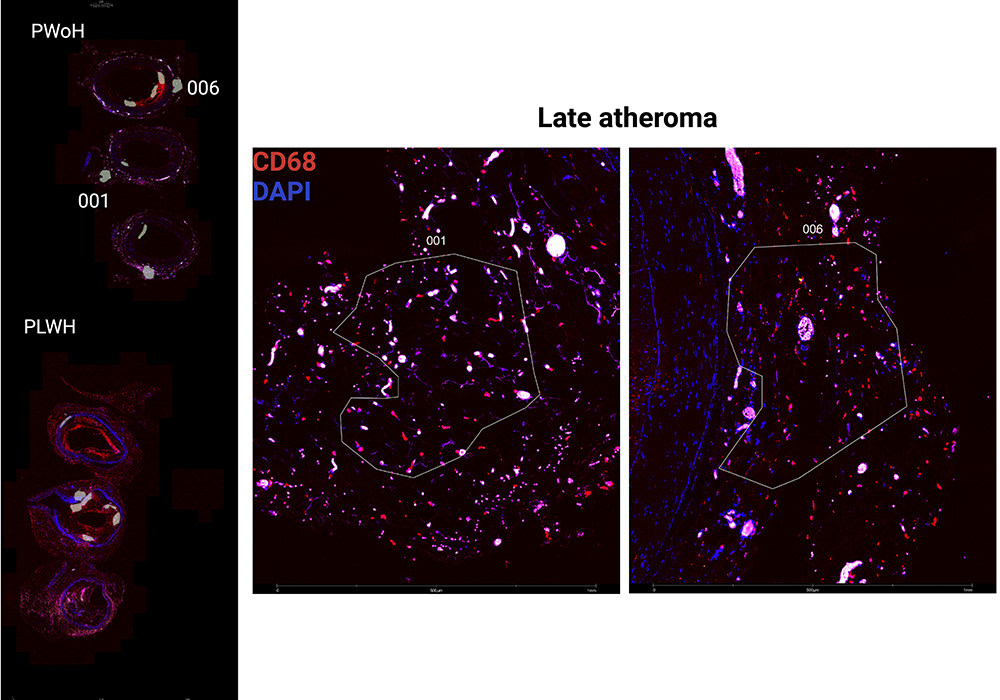
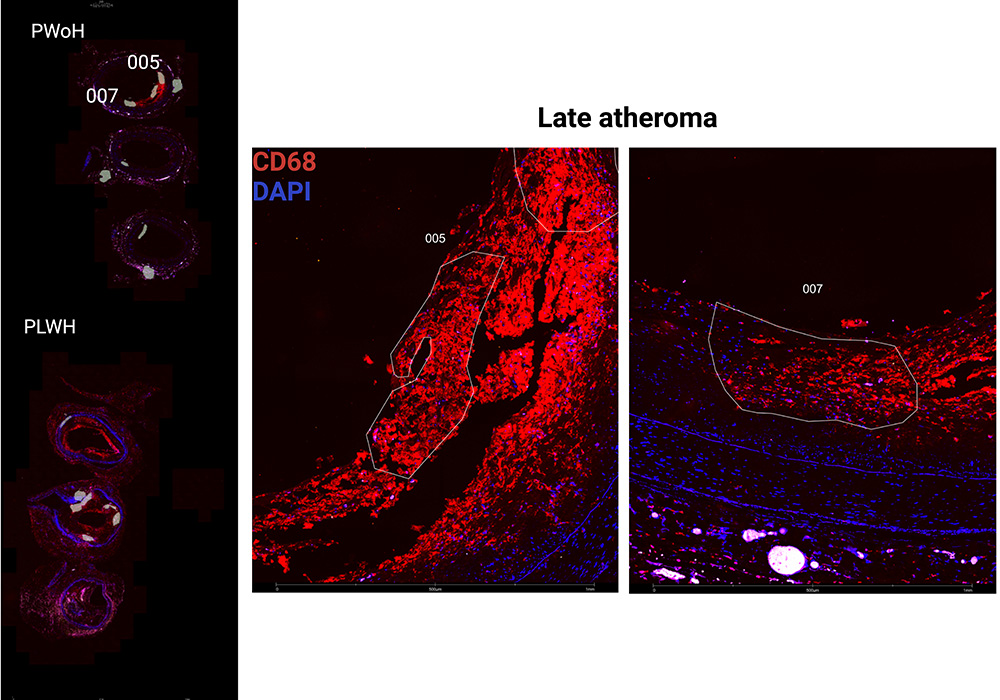
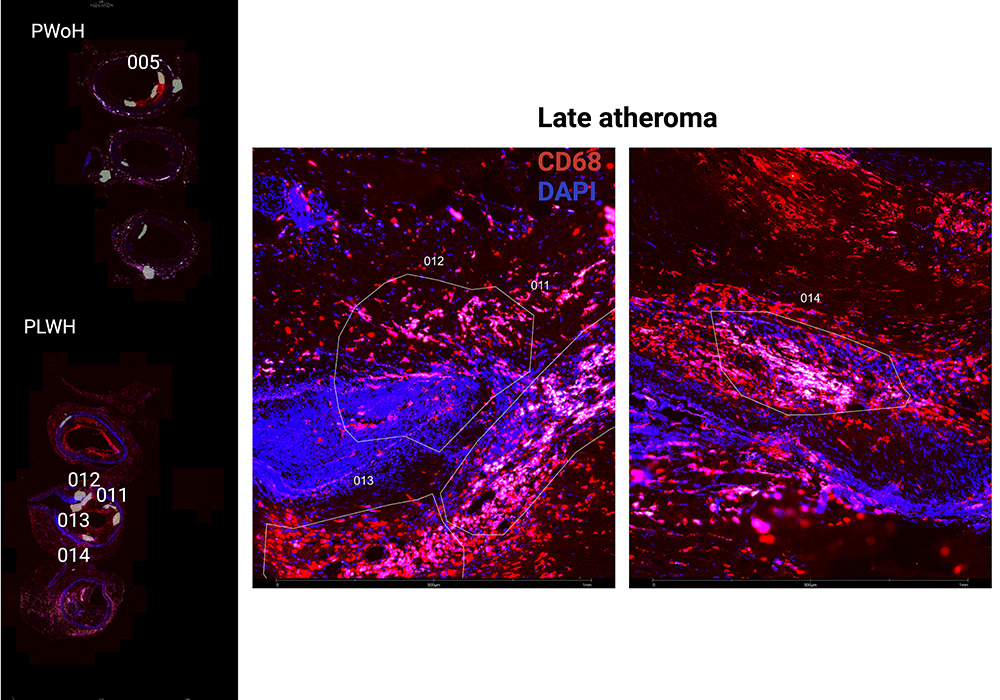
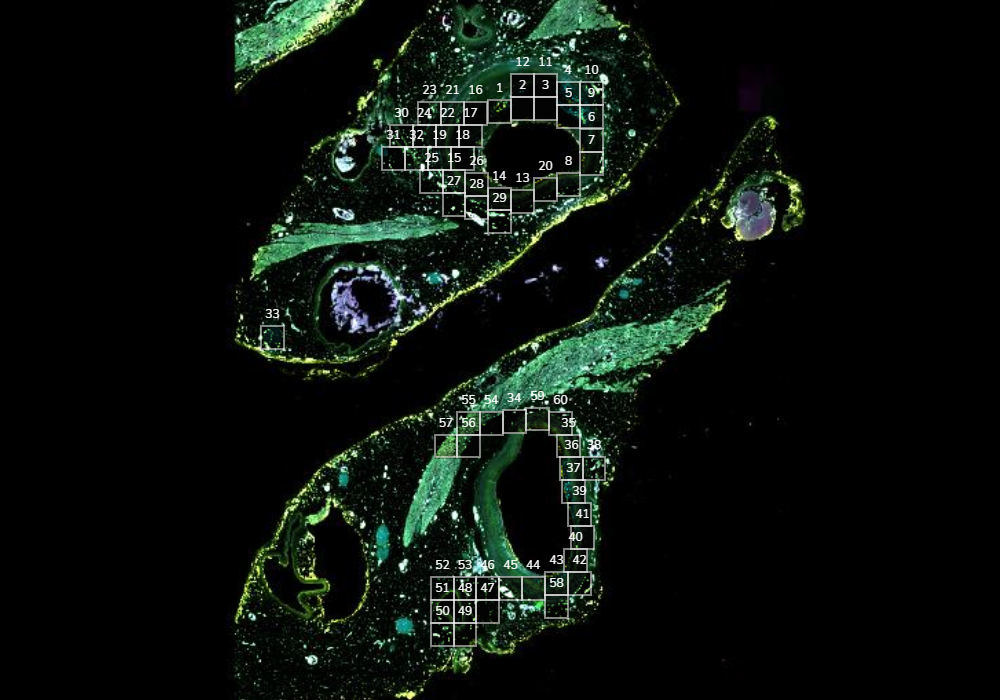
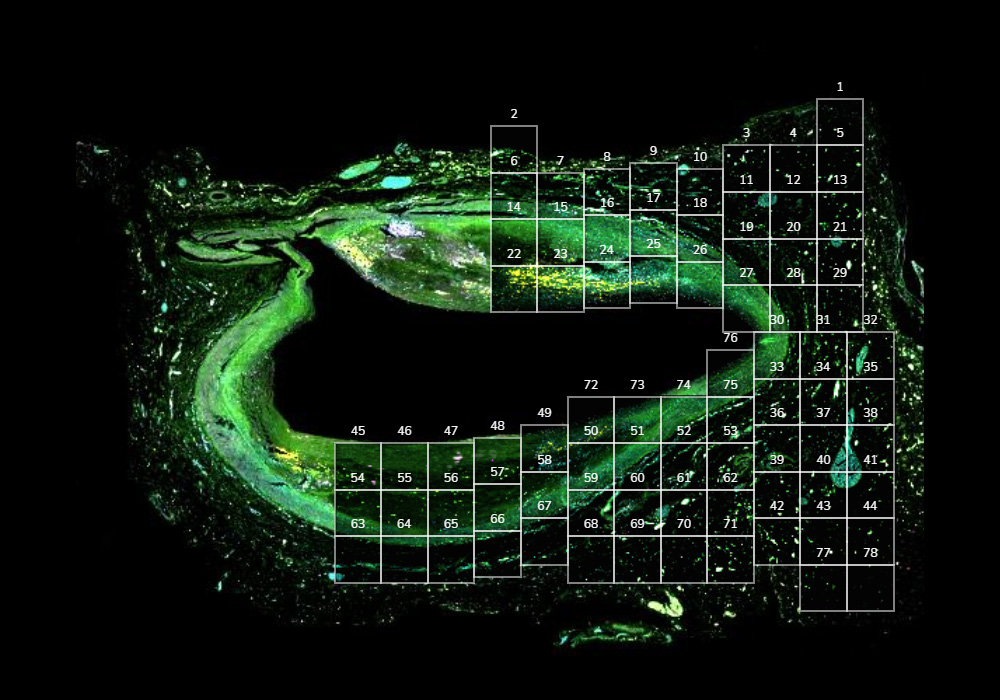
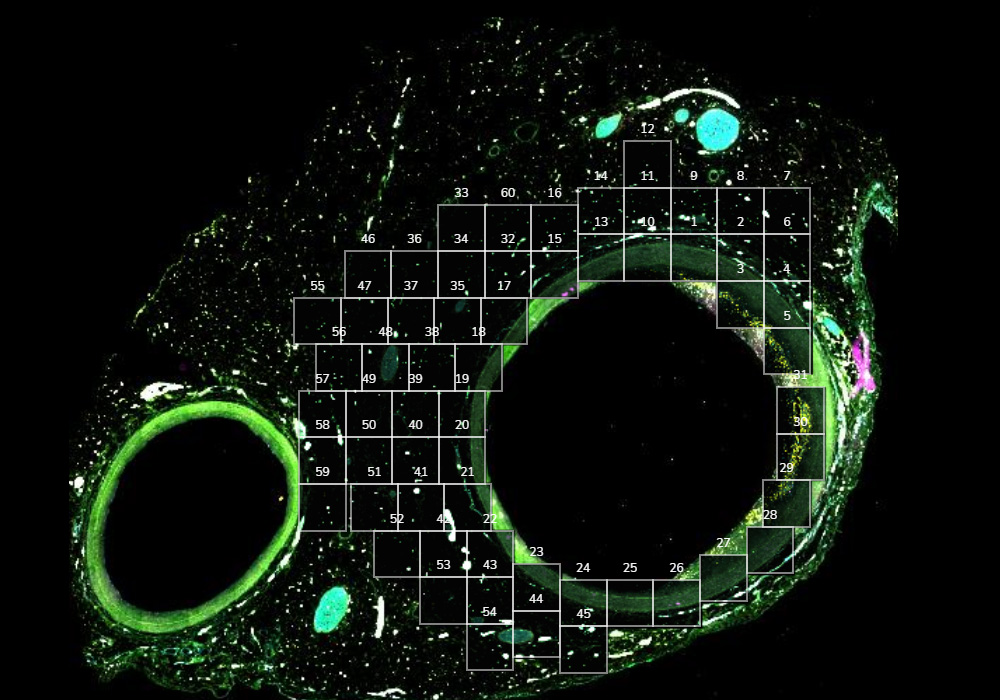
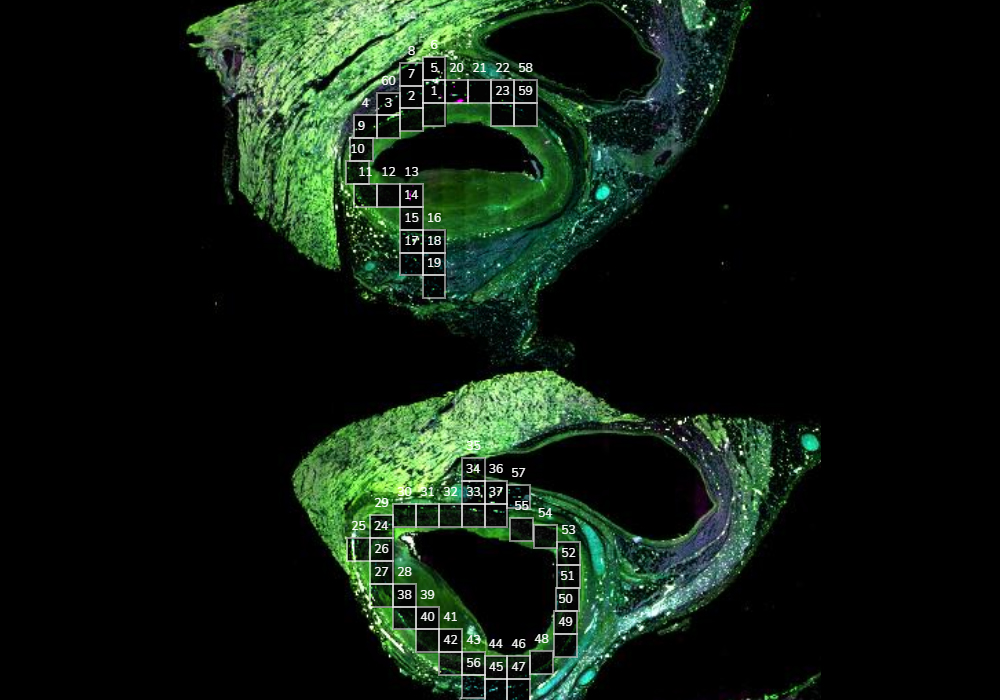
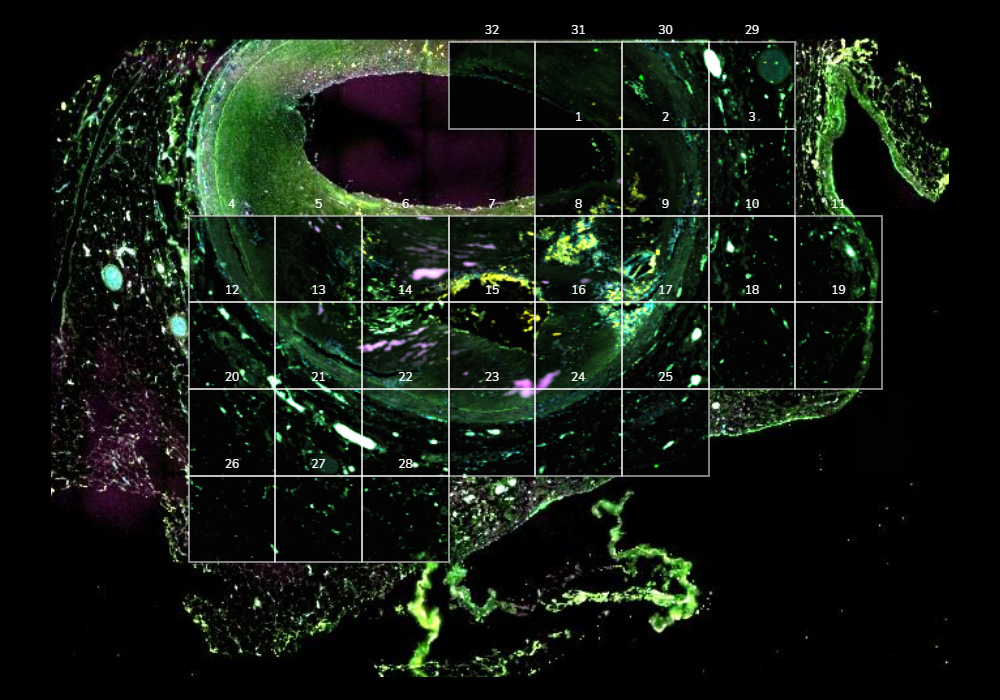
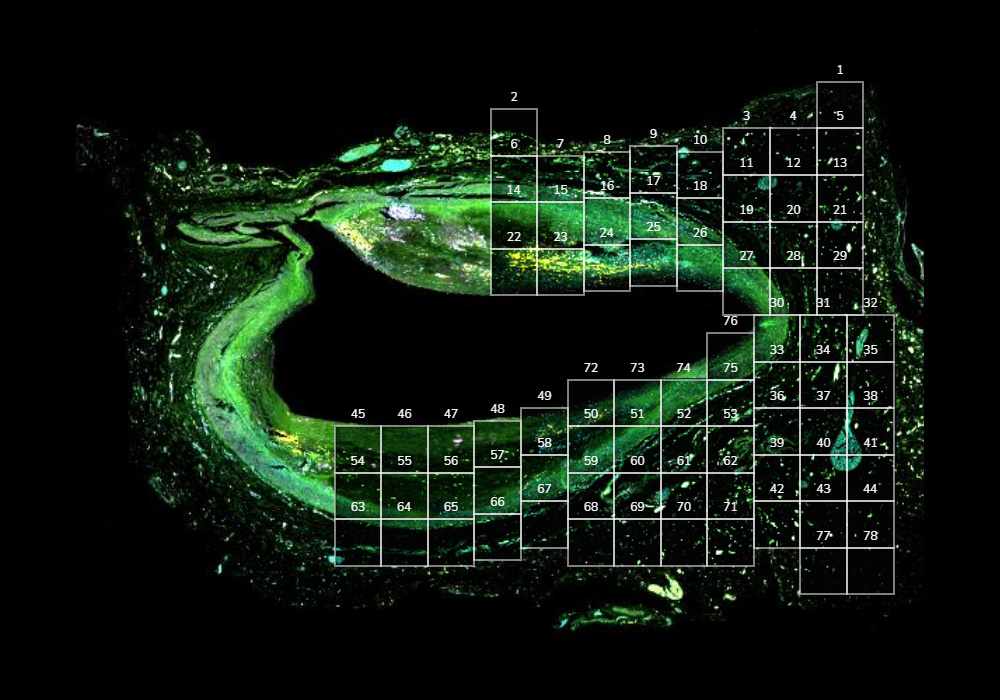
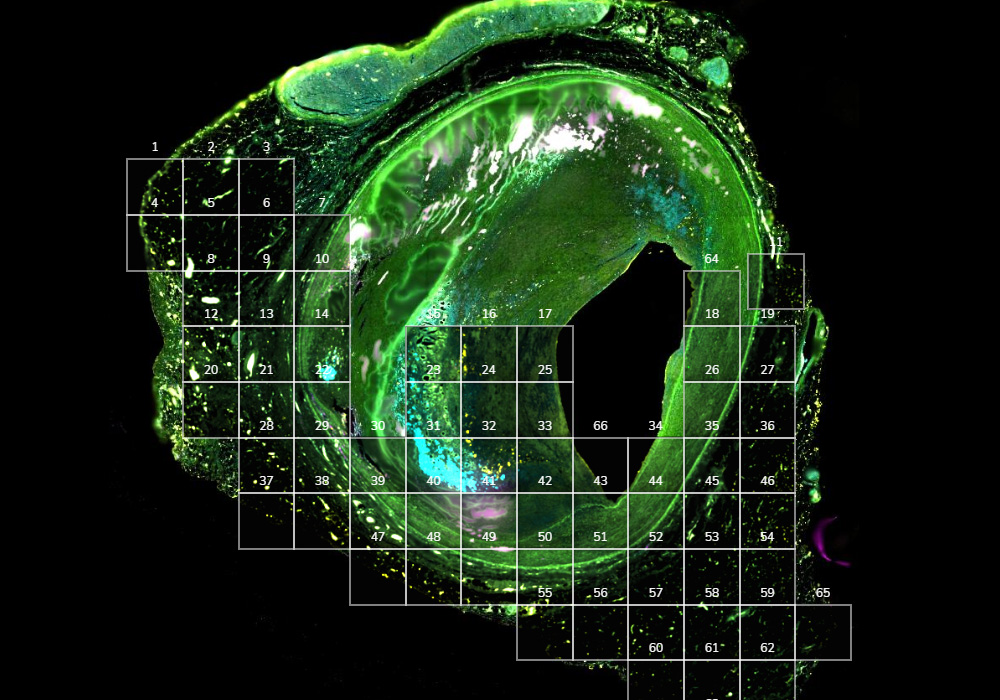
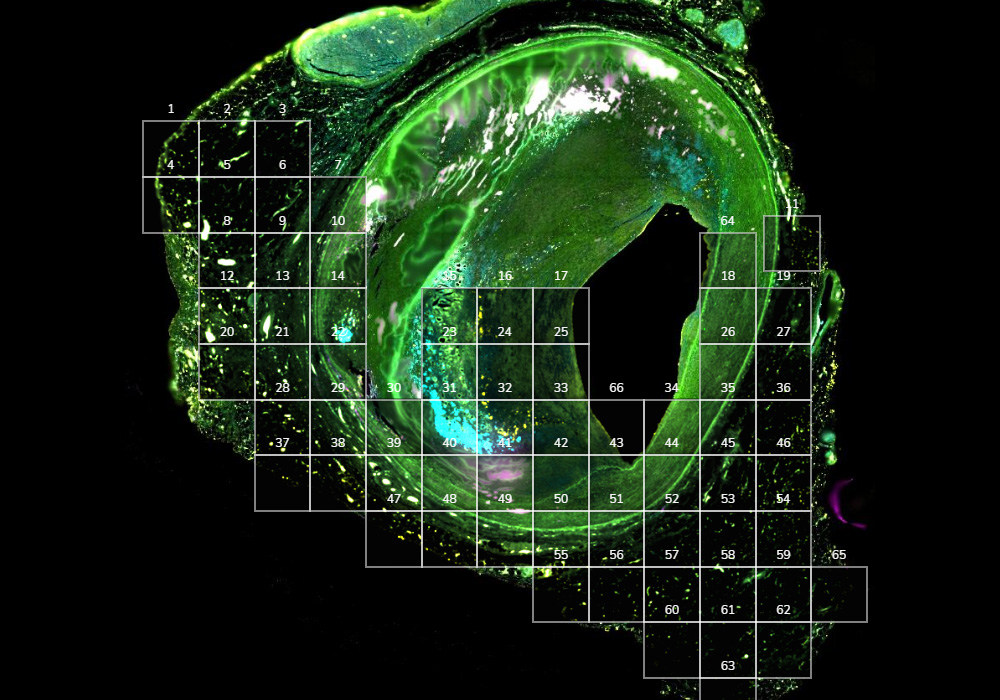
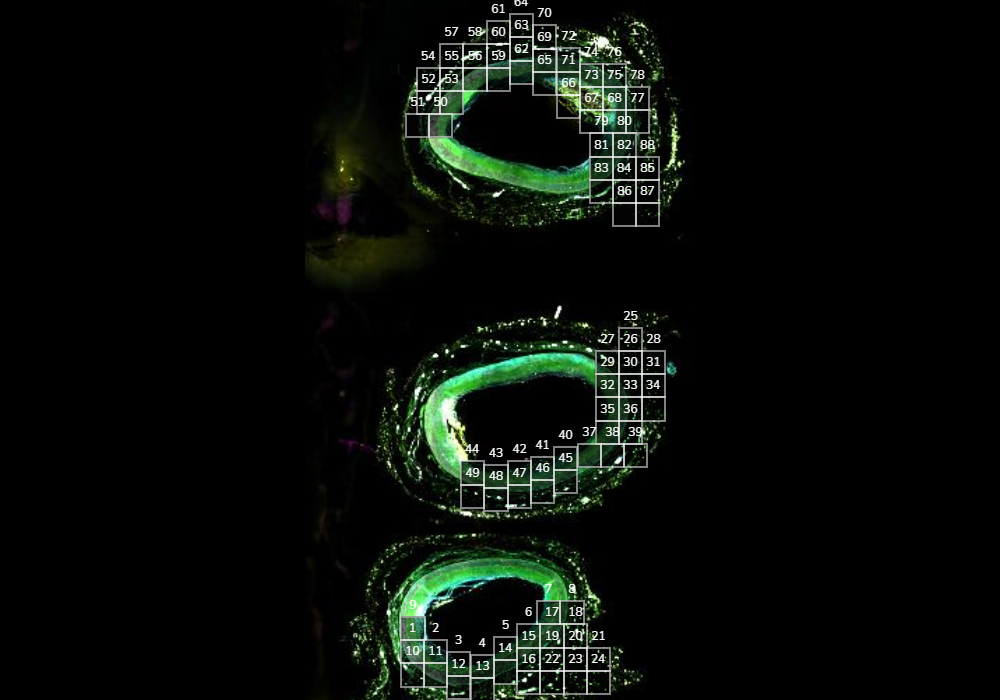
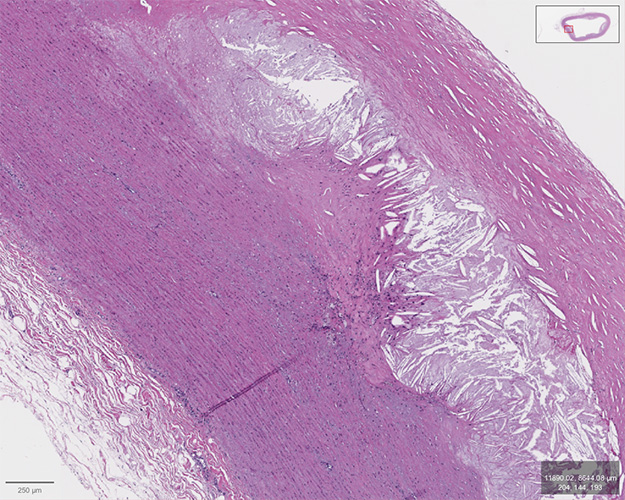
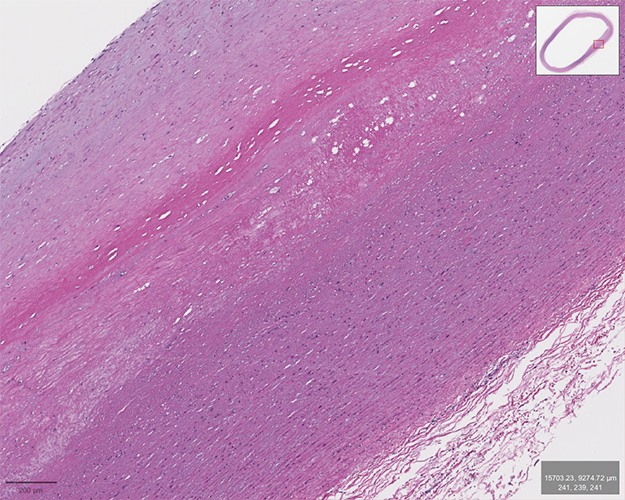
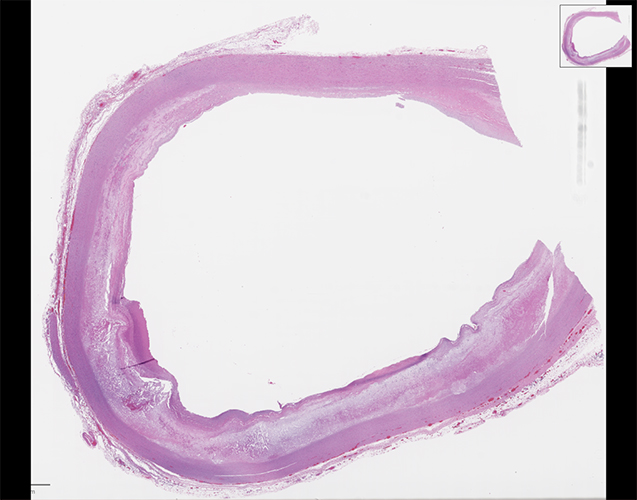
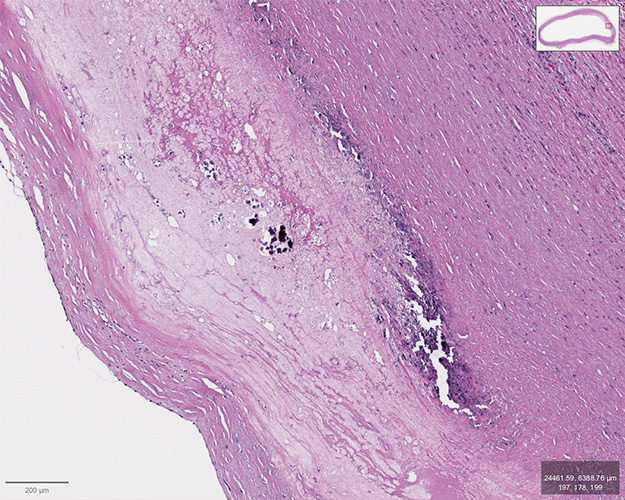
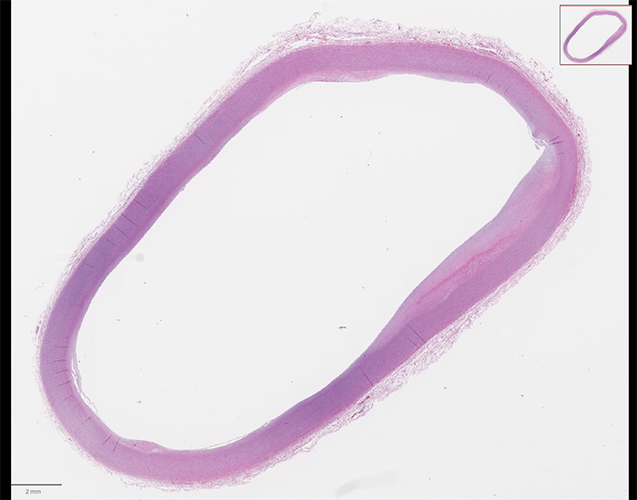
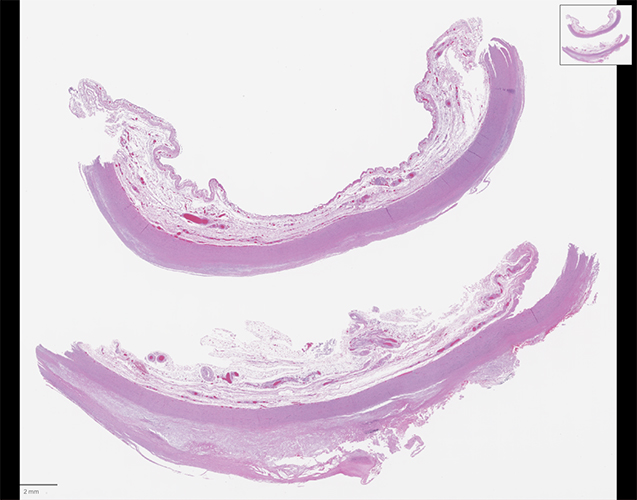
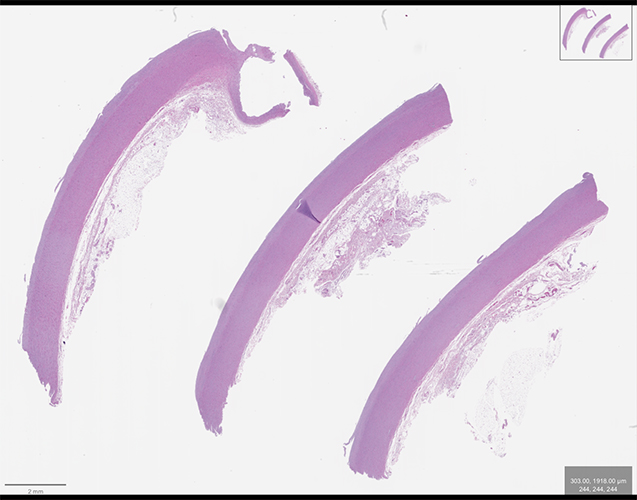
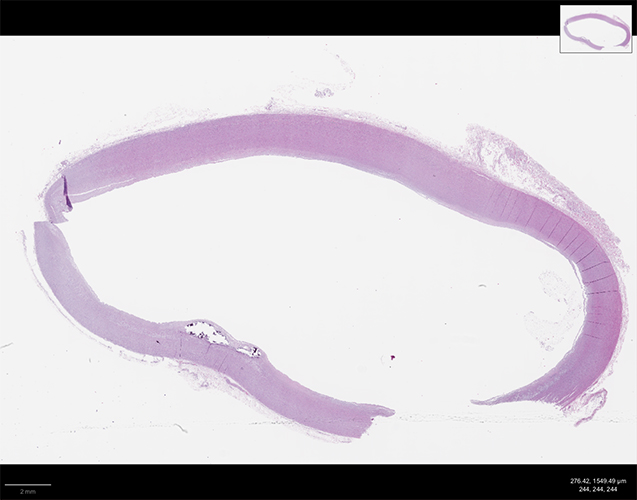
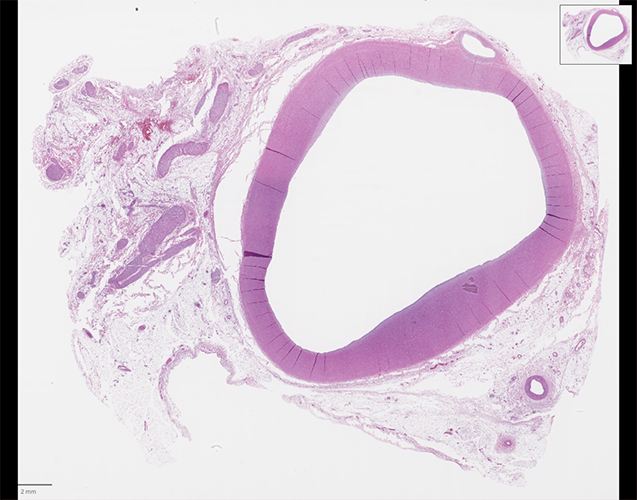
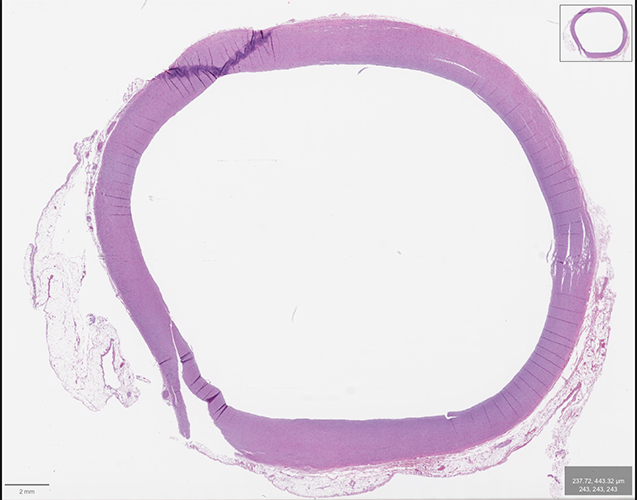
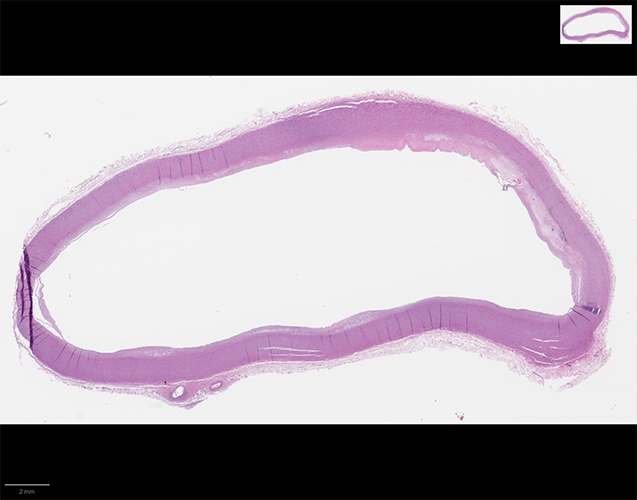
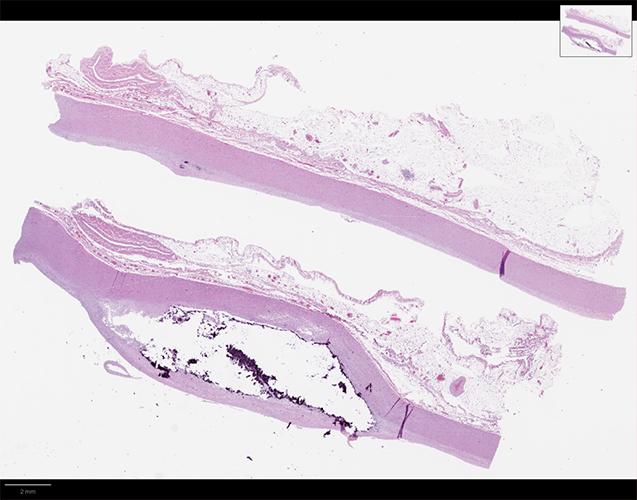
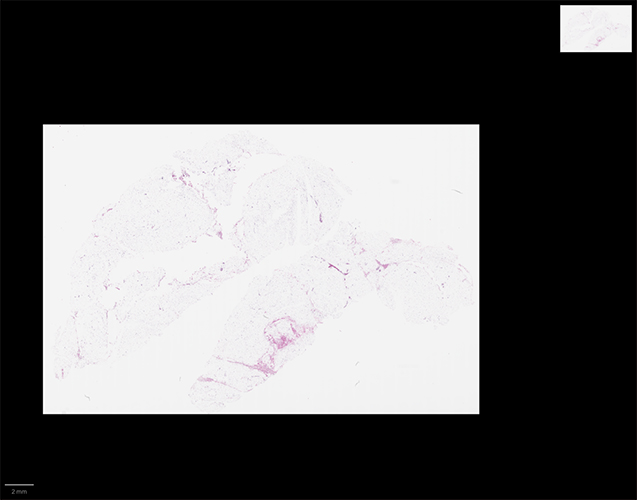
Immunofluorescent Imaging and Spatial Transcriptomics of Coronary Arteries
These images showcase cross-sections of human coronary arteries stained with fluorescently labeled antibodies. CD68 (red) marks macrophages, while DAPI (blue) labels cell nuclei. The samples compare coronary plaques from people living with HIV (PLWH) and people without HIV (PWoH), highlighting differences in immune cell infiltration across early and late stages of atherosclerosis.
Outlined regions represent manually selected regions of interest (ROIs) for downstream spatial transcriptomic profiling using the NanoString GeoMx Digital Spatial Profiler. These ROIs were selected based on immune marker expression and plaque morphology to capture spatially resolved gene expression data from distinct microenvironments within the lesion, enabling insight into how HIV status may influence the local immune landscape and atherosclerotic progression.